Safety And Necessity Of Thermal Esophageal Probes During Radiofrequency Ablation For The Treatment Of Atrial Fibrillation
Antonio Fasano, Prof Emeritus, Luca Anfuso, MD, Stefano. Bozzi, MD, Claudio Pandozi, Prof
San Filippo Neri Hospital, Rome, Italy.
Radiofrequency ablation is extensively used to achieve pulmonary veins isolation for the cure of atrial fibrillation. Luminal esophageal temperature can be monitored by means of suitable probes to prevent the onset of lesions.
To compute the thermal field generated by the ablation, to investigate the interaction between the electromagnetic field and the probe sensors, and to provide a safe interpretation of the temperature detected by the probe, supported by clinical data.
A mathematical model is formulated and the thermal and electromagnetic fields are computed. Experiments have been performed to assess the the influence of the ablator on the probe sensors. Clinical data have been collected during RF isolation of pulmonary veins in patients with atrial fibrillation.
The direct interaction between the radiofrequency source and the probe sensors is found to be negligible. Numerical simulations show that the outer esophageal wall can be much warmer than the lumen. Theoretical heating curves are compared with the clinical data selecting the maximal slope as the reference quantity. The clinical values range between 0.01°C/s and 0.15°C/s agree with the computed predictions and demonstrate that reducing the esophagus-atrium distance by 1mm causes a slope increase of 0.06°C/s.
The use of esophageal thermal probes is absolutely safe and necessary in order to prevent the occurrence of thermal lesions. The model is reliable, and describes effectively the generated thermal field. The external esophageal temperature can be considerably higher than the luminal one.
Key Words : Atrial Fibrillation, Esophageal Lesions, Esophageal Temperature Monitoring, Atrial Fibrillation Ablation.
Correspondence to: Claudio Pandozi, San Filippo Neri Hospital, Rome, Italy.
Radio Frequency Ablation (RFA) for Pulmonary Veins Isolation (PVI) is a largely applied procedure for the cure of Atrial Fibrillation (AF). It is well known that radio frequency (RF) can produce Esophageal Thermal Lesions (ETLs), from mild forms, to intramural hematomas, or ulcerations which can be asymptomatic or hemorrhagic and in some rare cases (e.g. atrial esophageal fistulae) can have lethal consequences. Altogether ETL incidence is slightly below 20%.1,2 Documentation of fistulae occurrence is relatively abundant.3,4,5,6,7,8 detailed analysis of complications connected to RFA can be found in the reports9,10,11 and frequency of complications in the overviews.12,13,4,15 The Luminal Esophageal Temperature (LET) increase is usually very modest, but temperatures well beyond 40°C, which can occur when the esophagus-heart distance is reduced, can represent a serious risk.16 A correlation of LET and measured distance between esophagus and the ablated PVs has previously been reported17 and several papers18,19 illustrate the esophagus anatomy and its implications on RFA.
The complexity of this framework confirms that LET monitoring, which offers the possibility of switching off power supply if temperature exceeds a safety threshold, is of crucial importance. Here we are going to discuss various aspects related to the thermal field generated during RF- PVI procedures based on numerical simulations and of experimental data.
The fact that during RFA only a relatively small LET variation is normally expected has somehow suggested that LET measurements can be optional. Somebody has even conjectured that esophageal thermal probes may contribute to the formation of ETLs20 because of power absorption by the metallic sensors. On the contrary, recent papers21,17 emphasize the importance of LET measurement.
In the sequel we will illustrate an experiment showing that the steel rings of a temperature esophageal probe do not catch any sizeable power, confirming the theoretical result of a recent paper.22 In any case, it must be remembered that the thermal sensors measure their own temperature, thus signaling any alarming situation, independently of its cause.
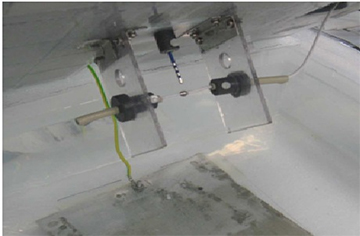
Figure 1. Apparatus for direct exposure of the sensor to the RF field
Next we shall use a mathematical model in order to compute the thermal field during a typical RF ablation for PVI and we provide some clinical data collected during RFA to support the conclusions based on the model. Our main intention is not only to furnish further scientific justification of the fact that esophageal thermal probes are totally harmless, but that they are an absolutely necessary tool to prevent esophageal lesions, as largely confirmed by clinical practise.23,24,25 In addition we will point out that LET measurements have to be correctly interpreted by the clinicians in order to determine a really safe switch off temperature.
Exposing Metallic Sensors To RF Sources
The following experiment has been performed at FIAB Laboratories. A RF ablator was placed in a slowly stirred saline solution (1.9%) kept at 38°C and it was set to deliver a power of 50W. A movable frame was placed in front of it (Figure 1), bearing (in three different sets of experiments)
- a thermocouple
- a thermocouple welded to a steel ring (as in the Esotherm probe)
- the same element coated with a 30 µm thick Teflon layer
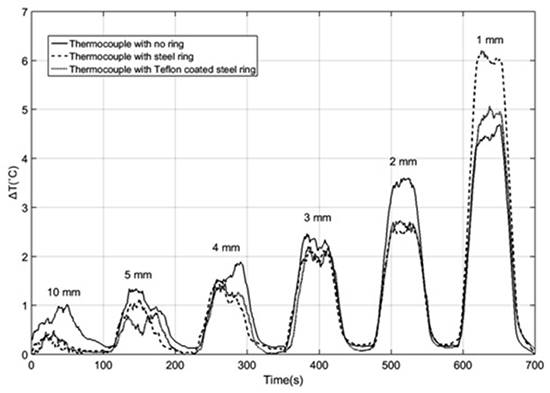
In each experiment the temperature was recorded at the following distances (mm) 10, 5, 4, 3, 2, 1 for an exposure of 1 min (preceded and followed by a 30 second pause). The outcome is illustrated in the Results section.
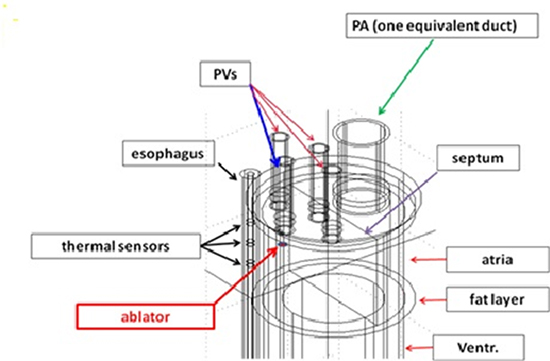
Already in the mathematical model developed in previous papers,26,27 with no esophageal probe, it was recognized that a rather rough geometrical representation of the interested domain was sufficient to compute the thermal field during RFA within a reasonable approximation. In particular it is not necessary to reproduce the actual organs shape, nor the pulsatile nature of blood flow. Here too we take a naive scheme as follows (Figure 2): the heart is a four-chamber immobile cylinder (external diameter 80mm), longitudinally divided by a septum of negligible thickness, impervious to blood and perfectly transmitting heat. Ventricles (internal height 70mm) are thicker than atria (internal height 50mm): we took respective thickness of 15mm, 3 mm. We must stress that the choice of the latter values is not critical (as pointed out in26), unless reducing the atrial thickness is accompanied by a reduction of the esophagus-electrode distance.28,29 The whole cylinder is coated by a fat layer (1mm thick). Blood flows freely and with constant cross sectional discharge in each atrium-ventricle pair (no valves). Four vessels enter the left atrium (with the average size of PVs), while all other chambers are connected with just one efferent or afferent pipe. Esophagus is sketched as a cylinder parallel to the heart (thickness 2.5mm) with the lumen occupied by a 4 mm diameter probe (the probe is actually thinner, and 4mm is slightly exceeding the diameter of the steel rings, still with the idea of deriving a conservative estimate of the power absorbed by the rings). The presence of the probe has been disregarded in other papers, but millimeters here do matter, as we shall see. In particular we plan to check the behavior of electric and thermal fields on the probe steel sensors. The distance between the outer esophagus wall and the fat coating is 3mm.The intermediate region is occupied by connective tissue, the surrounding domain has the form of a square box (20cm side) whose vertical axis coincides with the esophagus generatrix closest to the heart. Our cylindrical heart has equal distances from the top and the bottom face of the cube. Such a geometry is sketched in Figure 2. One of the PVs is placed so to face the esophagus and we examine the case in which the RF source is located there, in order to consider the most critical case for the possible occurrence of ETL. The thermal and electrical properties of the various elements are listed in Table 1.
Figure 2. Detail of the computational domain showing the thermal sensors and the ablator
For our purposes Pennes’ equation
1) ρc ∂T/∂t-k∆T=ρьcьω(Tь-T)+Q
is certainly appropriate to describe heat transfer. Here T is temperature, ρ is density, c the specific heat. The subscript b refers to blood. In the present context, since the expected temperature range is not very large, the perfusion coefficient ω can be taken constant in each tissue, according to Table 2.
Table 1. Thermal and electrical coefficients (from 26)
|
ρ (density) (kg m–3) |
c (spec. heat) (J kg–1 K–1) |
k (therm. cond.) (W m–1 K–1) |
σ (electrical conductivity) (S/m) |
| Steel (sensors) |
8000 |
480 |
15 |
7.4E+6 |
| Esophagus |
1000 |
3700 |
0.4 |
0.61 |
| Connective |
1000 |
3200 |
0.4 |
0.61 |
| Fat |
900 |
2200 |
0.2 |
0.02 |
| Heart |
1200 |
3200 |
0.7 |
0.61 |
| Blood |
1000 |
4180 |
0.54 |
0.99 |
The source term Q expresses power deposition from electromagnetic field, while metabolic heat supply rate can be neglected.
Heat flux continuity is taken at the interface between different tissues. At the external boundary a no flux condition is imposed (as a compensation to the fact that metabolic heat has been ignored). Concerning the electric field there is a large agreement in the literature that the quasi-steady approximation is largely justified, since the typical RF wavelength is of the order of one kilometer. Accordingly, the electric potential V is assumed to satisfy Laplace’s equation
(2) ∆V = 0
Table 2. Perfusion rate (sec-1) ω for various tissues30
| Heart |
Fat |
Connective |
Esophagus |
| 0.017 |
5.5.10–4 |
6.10–4 |
3.10–3 |
with continuity of the normal derivative at interfaces, and the condition V = 0 imposed on the dispersive electrode, identified with the cube face opposite to the heart with respect to the esophagus (so that the electric field is driven towards the esophageal region). A zero current condition is imposed on the other faces. The electric field is Ē = -▼V, the current density is σ Ē (σ is the electric conductivity, depending on the material), and the deposited power per unit volume in equation (1) is Q = 1/2 σ E2.
Figure 3. The probe Esotherm/Sensitherm (FIAB, Italy)
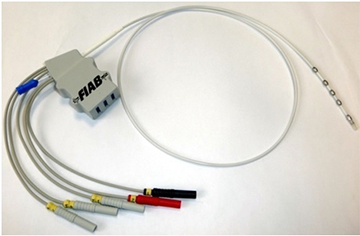
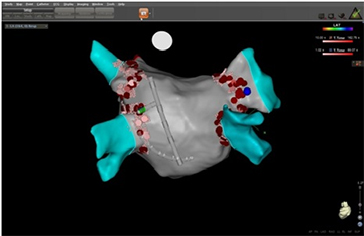
In this study we enrolled 14 patients scheduled for RF catheter ablation of symptomatic, paroxysmal or persistent AF. Transesophageal echocardiography was performed within 48 hours before the ablation procedure to rule out left atrial thrombi in every patient. AF ablation was monitored by LET in every patient. Written informed consent was obtained from all patients included in the study. Irrigated-tip radiofrequency ablation was performed with the CARTO 3 (BiosenseWebster, DiamondBar,CA) electroanatomic mapping system with a ThermoCool catheter (Biosense Webster). All left atrial ablation procedures were performed with the patient in sedation using propofol infusion and via single transseptal access to the left atrium. A shell of the left atrium was created and isolation of the ipsilateral pulmonary veins was performed using a point-by-point method. The activated clotting time was maintained between 250 and 300 seconds during all the procedure. Additional ablations were performed at the discretion of the operator, with a maximum of 35W and a maximum irrigation rate of 30 mL/min. Maximal energy delivery at the posterior wall was reduced to 25 W. To monitor LET, an intraluminal temperature probe (Esotherm/SensiTherm, FIAB, Italy) was used (Figure 3). The location of the probe was adapted according to the site of ablation. RF energy was discontinued when the temperature of the esophagus probe reached 39°C. Figure 4 exhibits an example of the position of temperature probe in relation to the ablation catheter during RF delivering.
Figure 4. 3D imaging showing the relative position between esophageal probe and ablation catheter
The thermal response of elements exposed to a 50W RF field at 500KH for 60 sec at various distances is reported in Figure 5
At distances larger than 1 mm the elements exhibit quite similar temperature increase. The bare thermocouple reaches a slightly larger maximal temperature. The effect of Teflon coating is generally negligible. Only at the distance of 1 mm the uncoated ring heats up one degree more than in the other cases. The Teflon coating has a strong electrical shield effect due to its extremely low electrical conductivity (order 10-24S/m, compared to ~8.106S/m for stainless steel), but it has very little influence on temperature (its thermal conductivity is only 50 times less than stainless steel). Thus the 1 degree difference has to be attributed to the eddy currents induced in the uncoated ring at a distance of 1 mm. This definitely shows that the much feared antenna effect has nothing to do with the Sensitherm probe in any practical application.
Coming to the computation of the thermal field during RF applications, we first deal with the electric field generated by an applicator with a single irrigated electrode with an applied potential of 50V and a power 30.9W.
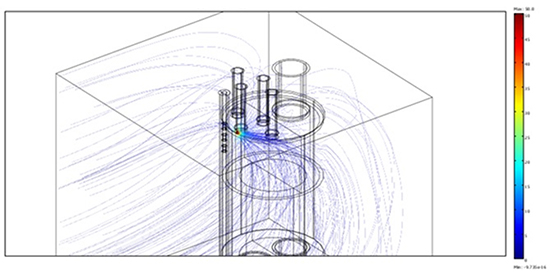
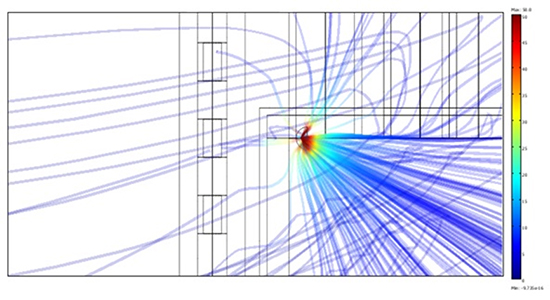
In Figure 6a we report a 3-D view of the electric field, strongly diverted by blood. Figure 6b shows the detail of the lines attracted by the steel sensors, though in a region where the field is so weak that no sizeable power is deposited. Indeed the power dissipated on the central sensor turns out to be less than 10-7 W. In terms of temperature variation, considering that the ring volume is of the order of 100 mm3, it corresponds to a temperature increase which is far below the sensitivity of the apparatus.
Figure 5. Comparison of the thermal response of the three systems to a 1 min exposure to a 50W RF source
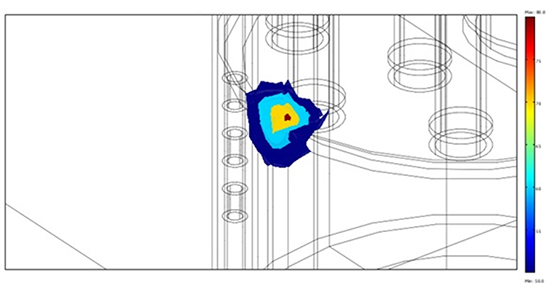
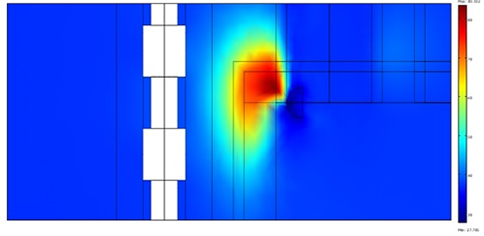
The figures above emphasize a concentration of the streamlines within the atrium, due to the larger electrical conductivity of blood, which actually carries away a large fraction of the delivered energy. The figures 7a and 7b provide a view (in 3-D, panel a, and on a vertical cross section, panel b), of the hot regions after a 1-min application.
Figure 6A. 3-D view of the lines of the electric field
The peak occurs at a distance of ~1 mm from the electrode, the strong heat removal being caused both by catheter irrigation and by blood flow. The mild gradient profile at the left is in correspondence to the esophageal wall facing the electrode. The strong thermal protection provided by the fat layer is clearly visible.
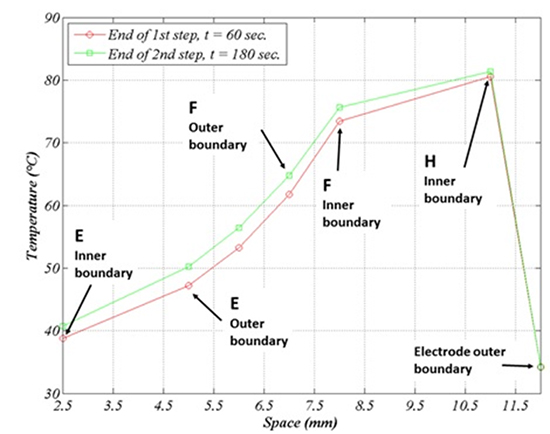
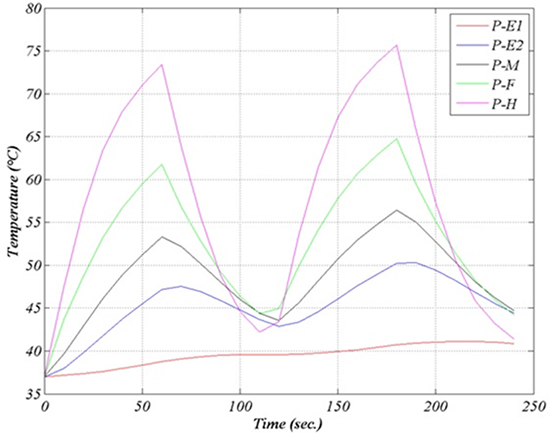
The temperature is lower in the region underneath the RF source, owing to the cooling action of blood flow. Figure 8 illustrates the temperature profile after a 60 sec. application (lower curve) and after a second application of equal duration, preceded by a 60 sec. pause. The temperature time evolution during a 240 sec. procedure (four alternated 1min intervals of application and pause) is reported in figure 9. No switch off procedure is simulated.
Figure 6B. Electric field (front view). The field is extremely weak in the sensors region
The farther we go from the emitting source the larger is the delay between the power switch off and the temperature decrease. After the first application the temperature in E2 keeps raising for about ten more seconds, up to 47°C. The temperature in E1 is not yet decreasing when the second application is initiated. Maximal and minimal temperatures are likewise shifted in time.
Figure 7A. 3-D view of isotherms 50, 60, 70, 80 degrees
Since the esophagus and connective tissue thermal diffusivities are rather close to each other (about 1.1 and 1.2.10-7m2/s respectively), it is possible to guess what happens if the thickness of either tissue is reduced by simply interpolating between the curves E1-E2-F. For instance, if the esophagus thickness is reduced to 2mm (20% reduction) leaving the connective thickness unchanged, the maximal luminal temperature is expected to increase to ~41°C (20% of the difference between the maximal internal and the maximal external temperature in Figure 6). If instead the connective thickness is increased by 0.5mm so to leave the esophagus lumen at the same location, then the luminal temperature will remain ~39.5°C, while the external temperature will decrease by ~1°C.
Here are some observations of clinical interest:
• On the curve E1 we can read the maximal luminal temperature, while the associated LET will generally be slightly less, being comprised between the temperature in E1 and the one at the opposite point in the lumen (see Figure 8b below: the maximal expected deviation is about 0.4°C).
• When the temperature in E1 attains the value of 39.5°C, the external point E2 has experienced the maximal temperature 47°C some thirty seconds earlier and has remained above 45°C for about fifty seconds.
Consequently one should be aware that it may happen that while LET measure suggests that one is working within a safe temperature range, the esophagus outer surface can be in danger of thermal lesion. This fact should suggest much care in selecting a really safe switch off temperature.
Figure 7B. Vertical cross section of the hot regions
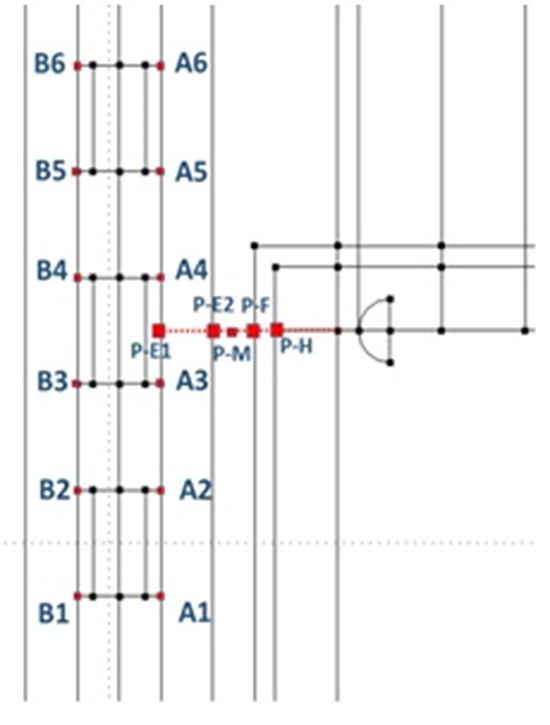
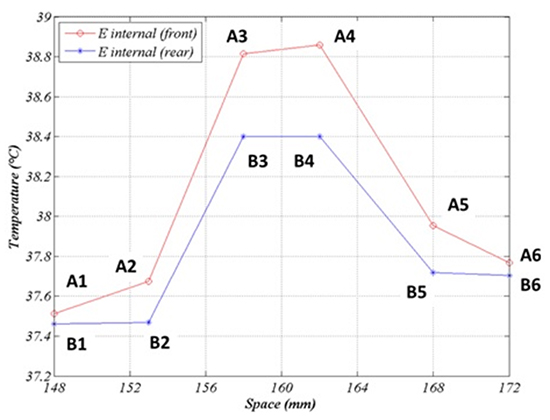
It is also interesting to explore the spatial temperature profile along the probe, for instance after the first application (Figure 10a, 10b).
The profile is rather flat near the maximum, but it falls down by ~1°C at a distance of ~1cm. This is the expected difference between the temperature recorded by the distal sensors and the median one, when the probe is ideally positioned, and it gives an idea of the error in LET measurement when it is not. A slight asymmetry can be noted, since temperature is moderately larger above than below the central point. Such a deviation is generated by the similar asymmetry in the thermal field shown in Figure 7b.
Figure 8. Schematic radial temperature profile after 60 sec (lower graph) and after 180 sec. (60 sec. on, 60 sec. off, 60 sec. on). Physical regions: esophagus (E) (2.5,5), connective (5,7), fat (F) (7,8), atrium (8,11), irrigated electrode tip (12)
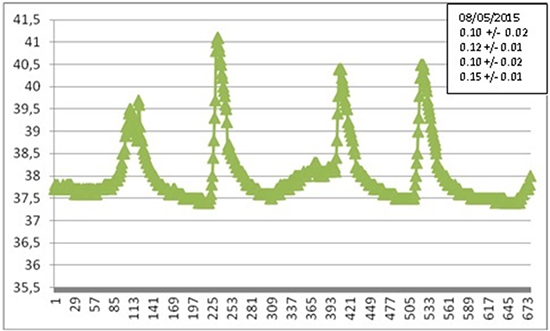
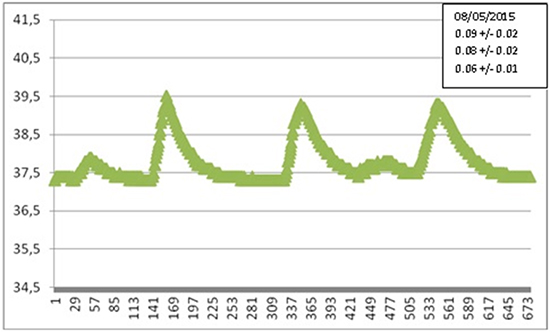
To be concise, in Figures 11a, 11b we show two of the many recorded LET heating curves, obtained during various AF ablation procedures at S.Filippo Neri (Rome), with the corresponding value of the parameter αexp, representing the maximal slope. For greater clarity we have reported only one of the three temperatures detected by the probe sensors.
Figure 9. Temperature time evolution (two 1-min applications with 1-min pause. (E1, E2 inner and outer esophagus wall, M, F, H like in the previous figure)
Results confirm a great variability of the temperature behavior, with no appreciable correlation between maximal slope and maximal temperature, since the latter is related with operation modalities. In many cases the maximal slope is close to the one predicted by our simulations. Larger (smaller) slopes are attributable to a shorter (longer) distance between the patient’s esophagus and the ablator. Different slopes observed in the same patients are due to different locations of the ablator and/or different pressures exerted.
Figure 10A. Points at which temperature is shown
We have computed the thermal and the electric fields generated by an irrigated RF emitting catheter in the left atrium, having LET as a specific target. Calculations are based on a mathematical model with a simplified geometry, which keeps into account the presence of an esophageal probe. We have compared LET with the temperature at the external esophageal wall, finding that the latter can be considerably higher and growing faster in the early stage of the treatment. This circumstance emphasizes the importance of the selection of the alarm temperature. We have been also dealing with the question of power deposition on the metallic sensors of the probe, both from the numerical and the experimental point of view, showing that the presence of metallic sensors produces no measurable perturbation. Indeed, out of the atrium the electric field is very weak, also because of the diverting action of blood flowing through the heart. We have discussed how the presented numerical simulation can be extrapolated to cases in which inter-organs distances are different from the ones in the chosen geometry. We have compared our results with a set of experimental data collected at S. Filippo Neri Hospital in Rome, selecting the maximal LET increasing rate as a significant quantity for comparison. In the large majority of cases such a parameter falls in a range which is in accordance with numerical predictions. Thus, it can be concluded that the model agrees rather well with the experimental data.
Figure 10B. Temperature profile along the probe after 60 sec. Points A1-A6 lie on the internal esophagus generatrix close to the emitting electrode. Points B1-B6 are symmetric to A1-A6 with respect to the esophagus axis
Comparing numerical simulations with clinical data is not a straightforward matter. The extreme variability of the configuration of the involved organs and of the patient’s reaction is not the only reason. Of course, the actual location of the RF ablator, which is moved several times during a procedure, is an important element in the evolution of the thermal field. Another parameter that can be very influential is the pressure exerted by the ablator tip on the tissue. In one paper31 the contact force applied was estimated to be in the range 10-40 g, which can proportionally displace tissues, making the ablator tip closer to the esophagus. Even a 2mm displacement can have a considerable influence on LET, introducing an important element of uncertainty. Further investigation is necessary, and is being carried out, to assess the influence of contact force on ETL occurrence. The presence of a switch off temperature threshold is a further complication, since a time shift in the attainment of such a temperature implies a deep modification of the thermal field after switch off. The time elapsed between the alarm and the actual interruption of the power supply is another random variable. A ten second delay while temperature is raising at the rate of 0.1°C/s introduces an extra temperature increase actually bound to exceed 1°C. Moreover, the duration of each application can be different. In these conditions the parameter which in our opinion can be sensibly compared is the maximal slope α during LET raise. Therefore we focused on that quantity. From Figure 9 we deduce the theoretical value αnum = 0.05°C/s and we note that the maximal slope βnum of the curve E2 (βnum = 0.20°C/s), actually represents an upper bound for αexp, which normally ranges between 0.01°C/s and 0.15°C/s. Simulations suggest that if the esophagus-RF source distance is decreased by 1mm the slope under consideration increases by 0.06°C/s, which makes experimental results clearly interpretable in the model framework.
Figure 11A. Selected experimental LET curve: temperature (°C) vs. time (sec). The corresponding value of αexp is shown in the side case
It is an old debate that metallic bodies deployed in biological tissues and exposed to a RF source may exhibit the so-called “antenna effect” with consequent abnormal heating, but such a phenomenon requires actually quite powerful fields and sufficiently large masses. For instance, a paper32 reports about lesions surrounding metallic clips (larger than the Sensitherm sensors) during a RF ablation in the liver, but the power used there was 200W (five to eight times the one employed for PVI), and the effect was not visible at a distance of 2 cm from the ablator tip. One could deduce that in the case of RF-PVI a small metallic body placed anywhere outside the heart is totally harmless. Indeed on the basis of our model we have confirmed that the electric field generated during RF-PVI decays very rapidly away from the ablator, becoming very weak in the esophageal region, also because of effective energy removal by the blood circulating in the heart.
For what it concerns the conjecture of the contribution of esophageal thermal probe to the ETL formation there are some caveats. The debate about the use of probes for LET measurement has been revived by the just appeared paper,31 reporting the outcome of the comparison between 40 procedures performed with the FIAB-Sensitherm probe (Figure 1) and an equal number of treatments carried out in similar conditions but with no esophageal thermal sensors. Since 12 lesions were found in the first group and only one in the second, the suggested conclusion was obvious. Nevertheless, the large majority of the “lesions” (10 out of 13) were actually simple erythemas and the results presented clearly suggest that their origin is rather attributable to an irritation of mechanical nature, caused by the long exposure of esophageal mucosa to a foreign object, particularly in conditions of heating beyond 40°C. Moreover, an experiment analogous to that of Müller et al.31 has been performed on two groups of 80 patients each in another paper,25 reaching precisely the opposite conclusion: no esophageal injuries among the patients with LET monitoring and 6 in the other group. Finally we remind that it has been recently pointed out that ETLs can be produced not by RF ablation, but rather by the procedure of transesophageal echocardiography sometimes preceding RF application.33,34
Figure 11B. Selected experimental LET curve: temperature (°C) vs. time (sec). The corresponding value of αexp is shown in the side case
In a forthcoming paper we intend to perform a parallel analysis on cryo-ablation procedures, which exhibits very peculiar aspects owing the larger thermal excursions. Indeed cryo-ablation is recognized to present similar risk as RFA. LET monitoring turns out to be of extreme importance when esophagus is potentially exposed to severe cooling.35,36
Contact force catheters were not used in the clinical procedures to measure the force applied by the ablator tip on the tissue. We are now performing a new study using exclusively contact force catheters (Thermocool SmarTouch catheter, Biosense –Webster).
On the basis of theoretical and experimental investigations we have shown that monitoring the luminal esophageal temperature by means of an esophageal probe is not only quite safe, but highly advisable. From the detected data it is possible to infer the temperature attained at the external esophageal wall, an element to be brought to the attention of clinicians.
Antonio Fasano is Scientific and R and D Manager at FIAB, Italy (Sensitherm/Esotherm manufacturer), Stefano Bozzi and Luca Anfuso are senior researchers at FIAB, Italy;


