Can We Predict Vagal Response to Cryoballoon Application Using Intracardiac Recordings?
Tolga Aksu1, Tumer Erdem Guler1, Serdar Bozyel1, Kivanc Yalin2, Ferit Onur Mutluer3
1Kocaeli Derince Education and Research Hospital, Department of Cardiology, Kocaeli/Turkey.2Usak University Hospital, Department of Cardiology, Usak/Turkey.3Koc University Hospital, Department of Cardiology, Istanbul/Turkey.
The effects of cryoballoon (CB) ablation in non-pulmonary vein sites have not clearly elucidated. Herein we present a new definition method which helps to predict autonomic modification effect of CB application using atrial electrogram (EGM) characteristics and vagal responses (VRs). A 54-year-old man underwent pulmonary vein isolation (PVI) for paroxysmal atrial fibrillation. Both atria were mapped with the aid of electroanatomical mapping system prior to ablation procedure. The atrial EGMs were divided into 3 groups according to duration, amplitude, and number of deflections. The sites demonstrating fractionated pattern on 2.5 centimeters outside of pulmonary vein ostia were tagged on the mapping to predict the relationship between VR and EGM characteristics during CB application. CB application in the PV demonstrating intensive fractionated EGMs caused a significant VR. We concluded that our case may be starting point to understand mechanism of PVI induced VR during CB application.
Key Words : Parasympathetic, Ablation, Atrial Fibrillation.
Correspondence to: Tolga Aksu, Associate Professor of Cardiology, Derince Education and Research Hospital Department of Cardiology, Derince Kocaeli,Turkey
Pulmonary vein isolation (PVI) using cryoballoon (CB) is a well known and effective strategy in treatment of paroxysmal atrial fibrillation (AF). To deal with high recurrence rates, alternative adjunctive modalities such as ablation of non-pulmonary vein (PV) trigger or vagal ganglia (VG) have been suggested. It was previously demonstrated that CB may cause substrate modification affect beyond PVI [1]. During CB application, vagal responses (VRs) consisting of bradycardia, asystole, and/or atrioventricular block may occur[2-4]. Due to the close spatial relationship between left atrial VG and PVs, VR is thought to have occurred through the intrinsic autonomic nervous system effects of CB ablation. However, the underlying mechanism and association between VR during CB application and the cardiac autonomic nervous system remain unclear.
In the present case, we aimed to define a new method which predicts autonomic modification effect of CB application using atrial electrogram (EGM) characteristics and VRs.
A 54-year-old man diagnosed with drug resistant paroxysmal AF was referred to clinic for CB ablation. The procedure was carried out under conscious sedation with intravenous administration of midazolam. After achieving the left atrium (LA) with the standard technique, a steerable 15 F over-the-wire sheath (FlexCath Advance, Cryocath) was positioned in LA. The Achieve™ Mapping Catheter (Medtronic) was then inserted into the inner lumen of the CB (Arctic Front Advance, Cryocath) and placed distal to the catheter within PV and LA
Before PVI, left and right atrial anatomy was assessed by electroanatomical mapping system (Ensite Velocity, St Jude Medical, Sylmar, CA, USA). Bipolar endocardial EGMs were displayed at filter settings of 30–500 Hz and 300–500 Hz (for EPS and spectral analysis, respectively) using EP Workmate (St Jude Medical, Sylmar, CA, USA) and measured at a sweep speed of 400 mm/s.
The following parameters were measured at baseline and after CB applications in each PV: atrium–atrium (AA), atrial-His (A–H) intervals and characteristics of the atrial EGM (duration, amplitude, and number of deflections). The EGMs were grouped as previously defined[5]:Normal (<4 deflections) EGM, low-amplitude fractionated EGM (LAFE) (≥4 deflections, <0.7 mV) and high-amplitude fractionated EGM (HAFE) (≥4 deflections, ≥0.7 mV) [Figure 1].The sites demonstrating HAFE or LAFE pattern on 2.5 centimeters outside of PV ostia were tagged on the mapping, in an effort to predict the relationship between VR and EGM characteristics during CB application. A twenty-percent increase on A-A or A–H interval or was defined as significant VR during PVI using CB. VRs during balloon thawing and deflation were excluded from the analysis. When more than one CB applications were performed at the same or close anatomical site, the first response was assessed in the analysis. The endpoint of the successful acute ablation procedure was confirmed by demonstration of entry and exit conduction block after CB application. All EGMs and map were recorded in sinus rhythm.
Figure 1. Electroanatomical endocardial bipolar voltage mapping of atria in posteroanterior (A) and anteroposterior (B) views
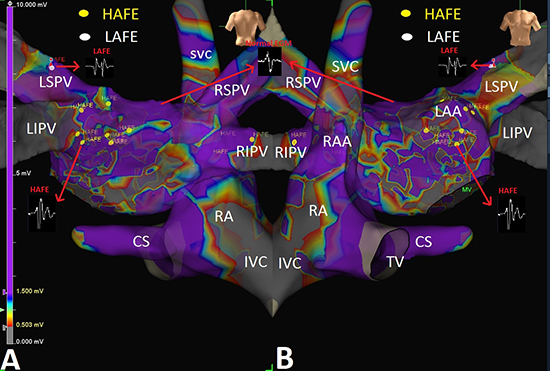
Atrial electrogram and scar maps were performed before pulmonary vein isolation. Fractionated electrograms on 2.5 centimeters outside of PV ostia were tagged and included in the final analysis. Purple and gray colors indicate healthy and dens scar atrial myocardium, respectively. Please see the text for details.
The numbers of evaluated points in the LA were 1365. Fractionated EGMs were observed at 65 (4.8%) sites (39 HAFE and 26 LAFE) in the LA. The great majority of fractionated EGMs (89%) were located on the left side of the left atrium. Twenty-one of 58 left sided fractionated EGMs were excluded from the final analysis due to distance from PV ostia. In the final analysis, 23 HAFE and 14 LAFE and 4 HAFE and 3 LAFE areas were detected around the left and right PVs, respectively. In the twenty-fifth second of CB application in the left superior PV, a significant prolongation on AA interval was observed [Figure 2]. Due to non-responsiveness to atrial pacing and asystole, ventricular back-up pacing was started with 100 bpm. Complete PVI was achieved at the 67 seconds of application. The CB freeze was limited to 240 seconds and no additional freeze application was delivered. PVI was achieved with a single freeze cycle in the left inferior and the right superior PVs. An additional freeze application was delivered in the right inferior PV because PVI was not achieved with the first freeze cycle. On these PVs, CB applications didn't result in any VRs.
A significant decrease on basal cycle length and atrioventricular Wenckebach point (from 850 ms to 670 ms and from 350 ms to 240 ms, respectively) were detected following the procedure [Table 1]. Clinical assessments, 12-lead electrocardiograms, and 24-hour Holter-monitor recordings were obtained at the baseline and at 1, 3, and 6 months after the initial ablation. At the end of 12 months follow-up period, there were no new atrial tachycardia or AF episodes.
Figure 2. 12 lead ECG recording during cryoballoon application in the site causing significant vagal response
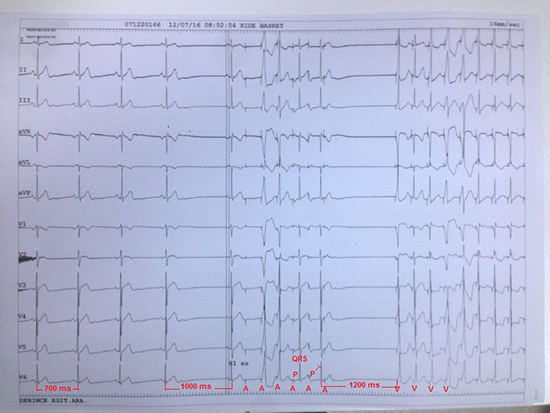
At the beginning of cryoballoon application basal cycle length is 700 ms. In the twenty-fifth second of freezing on the left superior PV, a 43% prolongation on AA interval from 700 ms to 1000 ms is seen. Please see that pacing from coronary sinus catheter with a cycle length of 400 ms is started immediately. The first pacing shoot does not capture atrium or ventricle. The next two shoots cause ventricular capture. The forth shoot captures atrium and is conducted ventricle with normal atrioventricular conduction. The fifth shoot captures atrium but is not conducted ventricle due to atrioventricular block. After cessation of pacing, there is no spontaneous atrial or ventricular beat. The next beats are related with ventricular pacing.
Table 1. Heart rate and heart rate variability parameters before and after cryoballoon ablation.
| Parameters |
Baseline |
Follow-up (Months) |
| HR, bpm |
|
|
|
|
| Minimum |
43 |
59 |
55 |
52 |
| Mean |
65 |
80 |
78 |
71 |
| Maximum |
111 |
113 |
110 |
111 |
| Heart Rate Variability by time domain |
|
|
|
| SDNN(ms) |
148 |
112 |
125 |
136 |
| RMSSD (ms) |
53 |
29 |
36 |
48 |
| pNN50 (%) |
26 |
14 |
18 |
23 |
| Heart Rate Variability by frequency domain |
|
|
|
| LF(ms2) |
6.4 |
4.9 |
5.1 |
5.9 |
| HF (ms2) |
6.1 |
3.8 |
4.2 |
5.5 |
| LF/HF ratio |
1.8 |
1.9 |
1.8 |
1.7 |
To the best of our knowledge, this is the first case investigating parasympathetic effects of CB application using atrial EGM characteristic during sinus rhythm. Our findings suggest that fractionated EGMs may predict VR during PVI using CB.
It was previously demonstrated that VRs during CB application might be a clue of VG ablation or modification[2-4].Yorgun et al [3]evaluated the effect of VR as a surrogate for cardiac autonomic nervous system modulation in 145 consecutive patients who underwent PVI by CB and investigated whether VRs during CB were associated with success rates during follow-up. Surprisingly, they found that VRs requiring atropine administration or temporary pacing is related with lower recurrence rates. In a similar way, Giannopoulos et al[5]demonstrated that coincidentally elicited VR during left atrial ablation causes lower AF recurrence rates. Therefore, a technique which defines anatomical location of VG may increase ablation success obtained with PVI-alone in patients with paroxysmal AF.
Lellouche et al[6] investigated whether there is any relationship between specific atrial EGM patterns and VRs to ablation during sinus rhythm. They identified 3 different left atrial EGM patterns related with VR: normal, LAFE, and HAFE and demonstrated that fractionated EGMs, specifically those with high amplitude were associated with a greater VR during ablation. The present report demonstrated that a similar approach may be used to predict VR during CB application, too.
On the basis of human autopsy studies, atrial VG were identified on five distinct anatomical localizations[Figure 3]: (1) the superior surface of the right atrium (superior right atrial ganglion), (2) the superior surface of LA (superior left atrial ganglion), (3) the posterior surface of the right atrium (posterior right atrial ganglion), (4) the posterior medial surface of LA (posteromedial left atrial ganglion), and (5) the inferolateral aspect of the posterior LA (posterolateral left atrial ganglion)[7].To determine anatomical location of VG during electrophysiological study, following three approaches have been used, so far[8]:(1) high frequency stimulation (HFS) application distinguishes normal atrial myocardium and VG sites with two different responses. If it causes a VR which is defined as significant prolongation of the PR or RR intervals, it means that this area is rich in vagal innervation. In normal atrial myocardium sites, no effect or non-significant changes on the PR or RR intervals are seen after HFS application; (2) the fast Fourier transform analysis differentiates compact (normal) atrial myocardium which demonstrates a well-defined homogeneous shape with one high power fundamental frequency and fast, uniformly decreasing harmonics like an atrial action potential and fibrillar atrial myocardium which shows low power fragmented and heterogeneous profile due to the incursion of the nervous fibers into the myocardium; (3) anatomical approach is performed in empirically identified sites.
Figure 3. Schematic view of vagal ganglia according to animal and human studies
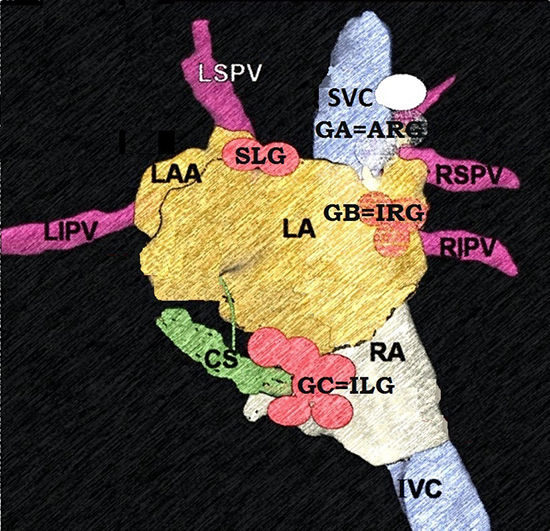
Please pay attention similar anatomical localization of ganglion A and superior or anterior right ganglion, ganglion B and posterior or inferior right ganglion, and ganglion C and inferior left ganglion. The figure was modified from our previous work with the permission of the editor in chief (Ref. 8). Both posteromedial and posterolateral ganglia were defined together as inferior left ganglion. Please see the text for details.
There are some major limitations of each of three strategies described above. For example, HFS may cause significant discomfort due to high amplitude stimulation. Conscious patients may not tolerate more than 15 V and general anesthesia may be needed. Although spectral analysis technique is more comfortable, it requires additional equipment and extends the procedure time. Lastly, due to different definitions for anatomical location of VG, empirical anatomic ablation may cause partial vagal denervation due to the inability to cover all fields.
Our case demonstrated that intracardiac EGM characteristics may be used to predict VR during CB application. Fractionated EGM pattern may be associated with a VR during CB ablation. However, there is no consistent definition of fractionated EGM in sinus rhythm. Although amplitude and duration of EGM are used for definition, the number of deflections was found as the strongest predictor of VR by Lellouche et al[6]. Likewise, we demonstrated in this case that amplitude or duration of EGM didn't have an effect on VR. A potential explanation for this response is that fractionated pattern may be related with heterogeneous and anisotropic conduction due to incursions of vagal fibers into myocardium. At this point, the question why VR was seen only after CB application on the left superior PV may come to the fore. Our most likely explanation for this issue is that the LAFE-HAFE ratio around the left superior PV is significantly higher than in other localizations. Thus, we considered that the VR occurred only in the left superior PV ablation but not in other PVs, despite the presence of abnormal EGMs in the right PVs or the left inferior PV in this case.
In a recently published study, Takahashi et al[9]investigated the association between and clinical implications of VG and epicardial adipose tissue (EAT) in LA. With this aim, HFS was performed at three sites within each of the five major anatomical LA VG (superior left, inferior left, anterior right, inferior right, and Marshall tract VG) to elicit VRs. Interactaction between the five VG areas and VR sites, left atrial EAT, and complex fractionated atrial EGMs was examined. Left atrial EAT overlapped 93 ± 14% of five major anatomical VG, and the VR sites. The EAT -based ablation eliminated 97.6% of the VR sites. A similar study evaluated the relationship between VR during CB ablation and the cardiac autonomic nervous system modulation by evaluating EAT locations[4]. EAT locations and changes in heart rate variability parameters were compared between the VR and non-VR groups, using Holter monitoring before ablation, immediately after ablation and one month after ablation. The VR group exhibited greater EAT volume overlaying the LA-left superior PV junction (6.1±3.6 cm3 vs 3.6±3.3 cm3, p=0.039) than the non-VR group. Three-dimensional computed tomography.
reconstruction images of the LA, PVs, and EAT were not available in the present case. Well-designed studies need to be conducted to investigate HAFE-LAFE sites and EAT location relationship.
The present case demonstrated that PVI using CB may result in partial VG ablation due to close proximity of PVs and VG. However, the largest number of VG -an average of 194 of the 458 per heart- is located on the posterior surface of the right atrium adjacent to the interatrial groove, and this VG contains much more neurons compared with the others [7]. In our recently published article, we demonstrated that vagal denervation may be achieved only by right atrial ablation in patients with functional atrioventricular block[10]. So, relying on partial VG ablation achived by CB may not be enough for a satisfying degree of vagal denervation and adjunctive right atrial ablation is expected to improve the results in these patients.
There are some limitations of the present work. Firstly, we did not compare EGM characteristics with the commonly used methods such as HFS or the fast Fourier transform analysis. A HFS from the point of HAFE or LAFEs might be at least needed to clarify this issue. In the present case, the great majority of HAFE and LAFEs were found in PV-left atrial junction which sites were compatible with typical locations of VG. Although the present case demonstrates a relationship between the abnormal EGMs and VR during CB application, the VR in this report may be due to vagal temporal response by pushing a balloon occlusion to PV, rather than an effect of VG modulation surrounding LA. We did not check the fractionated EGMs after CB ablation in terms of elimination of the potentials. So, it cannot be speculated that diminishing the abnormal EGMs or denervation of VG is the main reason of suppression of the VR occurrence in the present case. This report does not have sufficient result and strong evidence supporting the association due to case report nature. Further large-scale studies are needed to clarify this issue.
In conclusion, the present case may be starting point to understand mechanism of PVI induced vagal reflexes during CB application.


