Atrial Fibrillation and Objective Sleep Quality by Slow Wave Sleep
Younghoon Kwon1, Sneha Gadi1, Neil R Shah1, Christopher Stout1, Jacob N Blackwell, Yeilim Cho1, Ryan J Koene2, Nishaki Mehta1, Sula Mazimba1, Andrew E Darby1, John D Ferguson1, Kenneth C Bilchick1
1Cardiovascular Division, Department of Medicine, University of Virginia..2Department of Cardiovascular Medicine, Electrophysiology Section, Cleveland Clinic Foundation..
Self-reported poor sleep quality has been suggested in patients with AF. Slow wave sleep (SWS) is considered the most restorative sleep stage and represents an important objective measure of sleep quality. The aim of this study was to compare quantity of SWS between patients with and without AF.
We included patients with and without a documented history of AF by reviewing clinically indicated polysomnography data from a single sleep center. Patients on medications with potential influence on sleep architecture were excluded. Logistic regression was performed to determine the association between AF and SWS time (low vs. high) adjusting for age, gender, body mass index, and sleep apnea. In a 2:1 case-control set-up, a total of 205 subjects (139 with AF, 66 without AF) were included. Mean age was 62 (SD: 14.3) years and 59% were men. Patients with AF had lower SWS time (11.1 vs. 16.6 min, p=0.02). In multivariable analysis, prevalent AF was associated with low SWS independent of sleep apnea and other potential confounders (OR 2.5 [1.3, 5.0], p=0.006). Limiting the analysis to patients whose total sleep time was greater than 4 hours (by excluding N=31) resulted in more robust results (OR 3.9 [1.7, 9.7]. p=0.002).
AF is associated with more impaired sleep quality as indicated by lower quantity of SWS. More studies are needed to explore the mechanistic interactions between AF and sleep.
Key Words : Atrial Fibrillation, Sleep Apnea, Slow Wave Sleep.
Correspondence to: Younghoon Kwon,
Cardiovascular Division
Department of Medicine
University of Virginia
1215 Lee St
Hospital Expansion 4th floor, room 4027
Charlottesville, VA 22908
Atrial fibrillation (AF) is the most common cardiac arrhythmia with a growing public health burden. AF increases the risk of hospitalization, cardiovascular morbidity and mortality, and impairs quality of life. Among many established risk factors of AF, obstructive sleep apnea (OSA) has drawn significant attention as a potentially modifiable risk factor. In comparison, other aspects of sleep such as sleep quality have rarely been studied in relation to AF[2]. Poor subjective sleep quality has been reported in patients with AF. However, objectively measured sleep characteristics of patients with AF remains unclear.
Slow wave sleep (SWS) is an electroencephalogram-defined low frequency sleep state constituting about 10-20% of sleep and is considered to be the most restorative sleep stage. This proportion of SWS decreases with aging and can be affected by various central nervous system (CNS) medications. Both SWS proportion and quantity also partly depend on total sleep time. Therefore, the lack of SWS is an objective marker for poor sleep quality. SWS is also considered cardio-protective characterized by a predominantly parasympathetic state. While the associations of SWS or sleep architecture as a whole in cardiovascular health remains unclear, there have been suggestions that reduced SWS may be associated with increased cardiovascular risks.For example, a recent community-based study showed that low quantity of SWS was associated with AF independent of OSA severity, signaling an implication of sleep architecture in AF[9]. The current investigation therefore attempts to validate these findings and perform additional sensitivity analyses in a real world sleep clinic patient cohort. In this study we tested the hypothesis that patients with AF would have poorer quality of sleep as characterized by a lower quantity of SWS compared with those without AF.
Study Design and Subjects
Using an unmatched 2:1 case-control study design, we selected patients with and without AF referred to a single academic sleep center for diagnostic polysomnography (PSG). Consecutive patients with AF were identified from electronic health records retrospectively between January 2010 and December 2017 (a 7-year period) wherein detailed PSG data were available.
Consecutive patients without AF were identified retrospectively between July 2017 and December 2017 (a 6-month period). This 6-month period was chosen in order to have a similar number of non-AF patients because a recent report found AF prevalence among sleep clinic referred patients to be 6.5%, and the true prevalence estimated to be about 8% after taking into account underestimation error (thus 8% of the 7 year period was 6 months)[10]. The diagnosis of AF was confirmed by individual chart review by investigators. For patients with AF, the timing of AF diagnosis preceded that of PSG. Given the possible impact of benzodiazepines or Gamma-aminobutyric acid analogs (GABA) on sleep architecture, patients on these medications were excluded.[11,12] Patients who were receiving continuous positive airway pressure therapy were also excluded. The study was approved by the institutional review board at the University of Virginia (Charlottesville, VA, USA).
Overnight PSG was performed employing the standard channels recommended by the American Academy of Sleep Medicine (AASM) and data were processed with Embla Sandman Elite software (Natus Medical Incorporated, California, USA)[13].Sleep stages (N1, N2, N3 (or SWS)), and rapid eye movement (REM) sleep) were expressed both as absolute times in each stage and proportion of the sleep period (%) in each stage. N3 (SWS stage) was determined if more than 20% of an epoch consisted of slow wave activity defined by at least 75 microvolt amplitude in frequency of 0.5-2 Hz
[Figure 1]. The arousal index was defined as the number of arousals per hour. Sleep efficiency was calculated by dividing the PSG-based total sleep time (TST) by the total time between sleep onset and lights on. The apnea hypopnea index (AHI) was defined as the number of apnea and hypopnea events divided by TST and expressed as the number of events per hour. Apnea was defined as a reduction in airflow greater than 90% of the pre-event baseline, and occurring for longer than 10 seconds using a thermocouple signal. Hypopnea events were recorded when the amplitude of the nasal pressure flow signal decreased by more than 30% of the pre-event baseline for longer than 10 seconds; only hypopneas with at least 4% O2 desaturation were included in the AHI. AHI greater than 15 /h was considered clinically significant OSA.
Figure 1. Illustration of slow wave sleep on polysomnography montage.
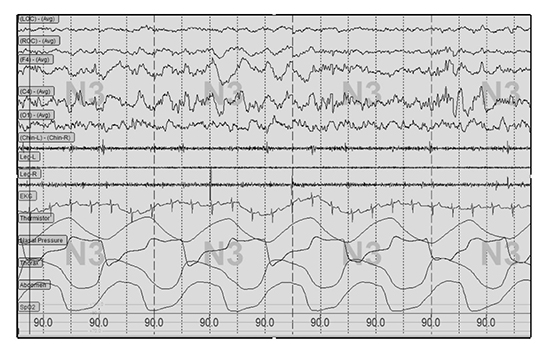
Note slow (delta) wave activity characterized by high amplitude (>75 microV) and frequency of 0.5-2 Hz amplitude shown on frontal and central electroencephalogram leads (F4, C4).
Covariates and Clinical Information
Demographic information (age, gender), body mass index (BMI) and medical history (hypertension, diabetes, heart failure and stroke) were collected from electronic health records. Detailed medications lists were also reviewed with particular attention to CNS-active agents including benzodiazepines, GABA agents, as well as antidepressants, all of which can potentially affect SWS. Echocardiographic finding of left ventricular ejection fraction (LVEF) from the closest timing to PSG were also recorded.
Baseline characteristics were stratified into low vs. high SWS time patient group based on the median value for those with and without AF. Either unpaired t test or Mann-Whitney test (for nonparametric distribution) was used to compare continuous variables between the two groups. For categorical variables comparison, either Chi-square or Fisher’s exact test was used as appropriate. Unconditional logistic regression was performed for the outcome of SWS above the median value (high SWS). Predictor variables included prevalent AF at the time of the sleep study. Due to a highly skewed distribution of SWS with many patients with little amount of SWS, we categorized SWS into low vs. high groups based on the median value. Sleep efficiency arousal index categories classified by respective median values were assessed as secondary predictors. Age, gender, BMI, and OSA were included in the model as covariates. Analysis was then performed after excluding patients who were on any CNS-active medications including tricyclic antidepressants and serotonergic antagonists[14]. Other sensitivity analyses included limiting the cohort to a TST of greater than 4 hours. Values were expressed as mean (SD) unless specified otherwise. For all analyses, a two-tailed p value less than 0.05 was considered significant. All analyses were performed using SAS software v. 9.2 (SAS Institute Inc. Cary, NC, USA).
A total of 205 patients including 139 patients with AF were eligible for the study. Among the 139 subjects, 28 had persistent or permanent AF with the rest having paroxysmal AF. During the sleep study, 19 patients were in AF during the study (for either part of the study or for its entirety). The overall cohort was characterized by middle-aged patients (mean age: 63 years, male: 59%) with a high burden of cardiovascular risk factors (Table 1). OSA was common with greater than half of the patients having an AHI>15/hr. Average TST was 283.1 (106.1) minutes. Average SWS amount and SWS % were 12.9 minutes (15.5) and 5.1 % (7.8), respectively.
When categorized by the amount of SWS time, patients with low SWS were older and had lower BMI, LVEF, and a higher prevalence of AF (78.4 vs. 57.3%, p=0.001) [Table 1a]. Patients with low SWS exhibited a higher severity of OSA by AHI but not by mean O2 saturation. Those with low SWS also had a higher arousal index and lower sleep efficiency.
Table 1a. Characteristics of study participants by slow wave sleep
|
Total (N=205)
Mean (SD) or Number (%) |
Low SWS (N=102)
Mean (SD) or Number (%) |
High SWS (N=103)
Mean (SD) or Number (%) |
P value |
| Age (yrs) |
62.9 (14.4) |
65.4 (14.0) |
60.5 (14.4) |
0.01 |
| Gender (Male) |
120.0 (58.5) |
66.0 (64.7) |
54.0 (45.0) |
0.07 |
| BMI (kg/m2) |
34.2 (8.5) |
32.9 (6.9) |
35.3 (9.7) |
0.04 |
| LVEF |
52.6 (11.1) |
50.6 (12.3) |
54.7 (9.2) |
0.01 |
| AF |
139.0 (67.8) |
80.0 (78.4) |
59.0 (57.3) |
0.001 |
| HTN |
106.0 (51.7) |
49.0 (48.0) |
57.0 (55.3) |
0.30 |
| DM |
85.0 (41.5) |
40.0 (39.2) |
45.0 (43.7) |
0.52 |
| Stroke/TIA |
16.0 (7.8) |
10.0 (9.8) |
6.0 (5.8) |
0.29 |
| SSNRI |
33.0 (16.1) |
13.0 (12.8) |
20.0 (19.4) |
0.19 |
| TCA |
6.0 (2.9) |
4.0 (3.9) |
2.0 (1.9) |
0.45 |
| CHADS2 |
2.0 (1.3) |
2.2 (1.9) |
1.9 (1.2) |
0.09 |
| OSA |
118.0 (57.6) |
71.0 (69.6) |
47.0 (45.6) |
0.001 |
| AHI (/hr) |
25.7 (23.9) |
31.9 (24.3) |
19.6 (21.9) |
<.0001 |
| Mean O2 Sat (%) |
94.4 (2.6) |
94.1 (2.4) |
94.7 (2.8) |
0.11 |
| TST (min) |
283.1 (106.1) |
264.2 (110.4) |
301.9 (98.6) |
0.01 |
| AI (/hr) |
30.1 (27.2) |
35.8 (30.6) |
24.4 (22.2) |
0.006 |
| SE (%) |
69.7 (18.5) |
66.4 (20.8) |
72.9 (15.3) |
0.01 |
| SWS (min) |
12.9 (15.5) |
2.1 (2.9) |
23.5 (15.6) |
NA |
AF, atrial fibrillation; AHI, apnea hypopnea index; AI, arousal index; BMI, body mass index; DM, diabetes mellitus; HTN, hypertension; LVEF, left ventricular ejection fraction; OSA, obstructive sleep apnea; SE, sleep efficiency; SSNRI, Serotonin–norepinephrine reuptake inhibitor; SWS, slow wave sleep; TCA, tricycle antidepressants; TIA, transient ischemic attack; TST, total sleep time. For continuous analysis, unpaired t test performed except for AHI (Mann Whitney test was performed). For categorical analysis, Chi square test used except for Stroke/TIA (Fisher’s exact test).
When categorized by presence or absence of AF, patients with AF as compared to those without were older and less likely hypertensive. BMI and the prevalence of OSA were similar between the two groups. Those with AF also had lower SWS time (11.1 vs. 16.6 min, p=0.02) and lower sleep efficiency (67.6 vs. 74%, p=0.02) ([Table 1b],
[Figure 2]).
Figure 2. Box plot. Distribution of slow wave sleep (SWS) time and sleep efficiency in patients with and without atrial fibrillation (AF).
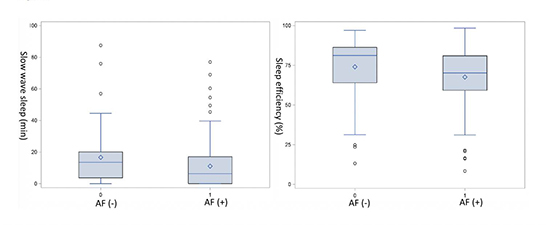
Table 1b. Characteristics of study participants by AF (atrial fibrillation)
|
No AF
Mean or Number
(N=66) |
AF
Mean (SD) or Number (%) (N=139) |
P value |
| Age |
57.2 (16.0) |
65.7 (12.7) |
<.0001 |
| Gender (Male) |
33.0 (50.0) |
87.0 (62.6) |
0.09 |
| BMI (kg/m2) |
35.2 (8.6) |
33.6 (8.4) |
0.21 |
| LVEF |
54.5 (9.8) |
51.8 (11.5) |
0.12 |
| HTN |
51.0 (77.3) |
55.0 (39.6 |
<.0001 |
| DM |
27.0 (40.9) |
58.0 (41.7) |
0.91 |
| Stroke/TIA |
4.0 (6.1) |
12.0 (8.6) |
0.59 |
| SSNRI |
14.0 (21.2) |
19.0 (13.7) |
0.17 |
| TCA |
2.0 (3.0) |
4.0 (2.9) |
0.95 |
| CHADS2 |
1.7 (1.2) |
2.2 (1.3) |
0.01 |
| OSA |
81.0 (58.3) |
37.0 (56.1) |
0.76 |
| AHI (/hr) |
25.4 (27.4) |
25.9 (22.2) |
0.96 |
| Mean O2 Sat (%) |
94.8 (2.6) |
94.2 (2.6) |
0.19 |
| TST (min) |
295.7 (114.9) |
277.1 (101.5) |
0.24 |
| SWS (min) |
16.6 (17.3 |
11.1 (14.3) |
0.02 |
| AI (/hr) |
33.0 (31.5) |
28.7 (24.9) |
0.29 |
| SE (%) |
74.0 (18.8) |
67.6 (18.0) |
0.02 |
AF, atrial fibrillation; AHI, apnea hypopnea index; AI, arousal index; BMI, body mass index; DM, diabetes mellitus; HTN, hypertension; LVEF, left ventricular ejection fraction; OSA, obstructive sleep apnea; SE, sleep efficiency; SSNRI, Serotonin–norepinephrine reuptake inhibitor; SWS, slow wave sleep. TCA, tricycle antidepressants; TIA, transient ischemic attack; TST, total sleep time. For continuous analysis, Unpaired t test was performed except for AHI and SWS (Mann Whitney test was performed). For categorical analysis, Chi square test used except for Stroke/TIA (Fisher’s exact test).
Multivariable logistic regression analysis showed that prevalent AF was associated with low SWS independent of OSA and other potential confounders (OR 2.5 [1.3, 5.0], p=0.006) [Table 2]. In this model, OSA was also associated with low SWS. Exclusion of OSA from the model did not significantly change the association between AF and low SWS (OR 2.3 [1.2, 4.4], p=0.01). Addition of either sleep efficiency or arousal index to the model yielded similar results (arousal index in the model: OR 2.8 [1.4, 5.6], p=0.003; sleep efficiency in the model: OR 2.5 [1.3, 4.9], p=0.008). Similarly, results remained comparable when patients taking any CNS active medications (by excluding N=38) were excluded (OR 2.9 [1.4, 6.2], p=0.007). A sensitivity analysis based on patients whose TST was greater than 4 hours (by excluding N=31) resulted in a stronger association between AF and low SWS (OR 3.9 [1.7, 9.7]. p=0.002). A model with SWS % as an outcome yielded similar, albeit slightly less robust, results compared with SWS (OR 2.1 [1.1, 4.0], p=0.02). Multivariable analysis designating other sleep quality metrics as secondary outcomes failed to show an independent association between AF and low sleep efficiency (OR 1.8 [0.9, 3.4], p=0.09) or arousal index (OR 1.0 [0.5, 2.1], p=1.0).
Table 2. Multivariable analysis of predictors of low slow wave sleep time
| Variable |
OR [95% CI] |
P value |
| OSA (vs. no OSA) |
2.8 (1.5,5.2) |
0.001 |
| BMI (per 1 kg/m2 ) |
0.97 (0.9,1.0) |
0.14 |
| Age (per 1 year) |
1.0 (0.99,1.03) |
0.47 |
| Gender (Male vs. Female) |
1.1 (0.6,2.1) |
0.75 |
| AF (vs. no AF) |
2.5 (1.3,5.0) |
0.006 |
AF, atrial fibrillation; BMI, body mass index; OSA, obstructive sleep apnea
In this sleep clinic cohort consisting of patients undergoing clinically-indicated PSG, we found SWS quantity was significantly lower in patients with AF as compared to those without. This finding was independent of potential confounding factors such as age, body habitus, gender, and OSA that are known to be associated with both AF and SWS[14-17].
This represents one of the first in depth examinations of the association of AF with objectively measured sleep characteristics in real world clinical practice. We primarily focused on SWS, as this represents the most restorative sleep stage. The majority of studies linking sleep and AF association have focused heavily on the sleep disordered breathing component (e.g. OSA). In contrast, there is a paucity of studies examining qualitative aspects of sleep in relation to AF. A recent survey-based study found that patients with AF report shorter sleep duration and poorer sleep quality compared with age-matched subjects without AF. Interestingly, among the patients with AF, those who underwent successful cardioversion and maintained sinus rhythm had improved sleep quality at 6 months whereas those who had recurrence of AF did not[3]. Another study found that up to about half of AF patients reported poor sleep quality, and the prevalence of poor sleep quality increased incrementally with greater AF symptom severity[4]. While these studies were all based on self-reported sleep quality questionnaires (both using the Pittsburgh Sleep Quality Index inventory), one community-based study assessed objective sleep quality metrics, including SWS quantity, arousal index, and sleep efficiency found a dose dependent inverse association between SWS quantity and AF highlighting the potential association of the sleep architecture in the pathogenesis of AF[9]. Furthermore, a recent study by Christensen et al. found that sleep disruption was a predicter of AF before and after adjusting for OSA and other confounders, and in the subset of 1127 that had PSG, every standard deviation decrease in REM sleep quantity was associated with an 18% higher risk of developing incident AF[18]. In this context, the current study was intended to examine whether real-world sleep clinic patients with AF would have more impaired sleep quality as measured by SWS.
In this sleep clinic cohort, patients with AF exhibited more impaired sleep quality as indicated by lower quantity of SWS compared with those without AF. This difference in SWS amount persisted after controlling for potential confounders. Various sensitivity analyses revealed that AF was associated with approximately 2-3 times higher odds of having low SWS time. Exclusion of patients with ‘any’ CNS active medications did not alter the results. Since shorter sleep duration and longer wake after sleep onset time, owing to an unfavorable sleep environment during in-lab sleep study setting, can curtail SWS time and, in turn, impact the results, we repeated the analysis excluding patients who achieved less than optimal TST (less than 4 hours). By limiting our analysis to this group of reasonable TST, we uncovered an even stronger association (OR ~4). This suggests that AF’s association with low SWS may be even stronger in a usual sleep setting beyond the sleep lab environment where TST is expected to be much longer. Given OSA’s negative effect on SWS time via sleep disruption, it is not surprising that OSA was also independently associated with low SWS[15]. However, we did not find any evidence of a confounding effect of OSA on the association between AF and SWS considering the minimal difference in the results with or without OSA in the model. Similarly, we did not find any association of other sleep quality measures including sleep efficiency or arousal index on with AF and SWS. Furthermore, in a secondary analysis, we did not find any independent association between AF and sleep efficiency or arousal index, other key sleep quality metrics commonly obtained from PSG.
SWS is a sleep stage characterized by substantial presence of electroencephalographic slow wave activity and is the deepest sleep state with the highest arousal thresholds. As such, SWS is considered the most recuperative sleep period and is often indicative of high quality sleep[19]. Well-described SWS rebound after either total sleep or selective SWS deprivation implies that SWS is subject to a highly regulated homeostatic process. While our understanding of the functional role of SWS is still very limited, SWS has been implicated in neurocognitive and autonomic regulation[20] .In fact, SWS is considered to be cardio-protective sleep state characterized by decreased sympathetic and increased parasympathetic tone. In this context, it is noteworthy that an imbalance in the complex interplay between sympathetic and parasympathetic activity has been implicated in the pathogenesis of AF[21]. Although we are unable to suggest any causality, given the design of the study, a few theories can be postulated based on our findings. First, consistent with our overarching hypothesis of this study, AF may influence sleep quality as previously suggested by other self-report-based studies. Increased sympathetic tone, or other comorbidities such as depression and anxiety, commonly found in patients with AF, could lead to poor quality of sleep.[22,23] Decreased SWS has been reported in patients with depression[24,25]. Conversely, it can be viewed that decreased SWS and a subsequent reduction in the cardio-protective state may play a role in the pathogenesis of AF. Finally, decreased SWS may be a simple marker of underlying autonomic dysfunction or other unknown substrates for electrophysiological dysregulation including AF. In this regard, one may speculate whether the decrease in SWS with aging plays any role in the increasing risk of aging-related AF.
Another important aspect of sleep quality is its implication on cognitive function[26].SWS loss is linked to impaired memory consolidation[27,28]. On the other hand, a number of studies have demonstrated a higher risk of cognitive decline in patients with AF independent of stroke[29,31]. Although the mechanism behind this association remains unclear, findings of this study raises a question whether sleep quality, specifically SWS, may have any pathophysiological role in linking AF with cognitive decline[32]. Similarly, SWS may have implications in the AF-stroke relationship. Future studies on SWS’s impact on stroke may offer more insights into a potential role of SWS in mediating the risk of stroke in AF.
A number of limitations need to be considered in our study. Although the timing of AF diagnosis preceded that of the sleep study, our study is inherently cross-sectional by nature. Findings of the sleep study do not represent an event or outcome but likely stable sleep traits. Therefore, causality cannot be assumed. Because only small portion of patients were in AF during the sleep study, a subgroup analysis to determine the impact of nocturnal AF rhythm (vs. non-AF rhythm) was not feasible. However, it is our opinion that the association found in our study (SWS quantity and AF) is predominantly related to the underlying pathophysiology or substrate of AF rather than to the AF rhythm by itself. Similarly, because of a small proportion of patients with permanent / persistent AF, analysis based on the subtype was not feasible. A prospective examination of the relationship would be valuable in the future. Although in-lab PSG is considered the gold standard method of objective sleep evaluation, one time PSG performed in the sleep lab environment (vs. home) may not represent true sleep architecture. Self-reported sleep quality metrics would have provided more insights into the understanding of our findings as it is unclear how the difference in SWS is reflected in subjective perception of sleep quality, which may be important by itself. However, it is well described that sleep quality is a complex construct and is difficult to measure, with prior studies showing that subjective sleep quality has poor correlation with objectively measured sleep quality[33,34].Thus, the focus of this study was on objective PSG measures. The adoption of forthcoming wearable sleep technologies capable of accurately capturing sleep architecture over longer periods of time may allow us to yield more valid and robust analyses in this regard.
In conclusion, in a sleep clinic setting, patients with AF spent less time in SWS during sleep compared to those without AF, and this association was independent of OSA and other risk factors. Further studies investigating the clinical significance of these findings is warranted.


