Bipolar Voltage Mapping for the Evaluation of Atrial Substrate: Can We Overcome the Challenge of Directionality?
Takanori Yamaguchi1, Akira Fukui 2, Koichi Node 2
1
Department of Cardiovascular medicine, Saga University, Saga, Japan.2
Department of Cardiology and Clinical Examination, Faculty of Medicine, Oita University, Yufu, Japan.
The relationship between atrial fibrosis and atrial fibrillation (AF) has been proven. Patient specific substrate ablation targeting fibrotic tissue estimated by bipolar voltage mapping has emerged as an alternative strategy for additional substrate modification beyond pulmonary vein isolation. The primary mechanism of a low-voltage electrogram has been suggested to be atrial fibrosis, however, no direct correlation between histological fibrosis and low-voltage zone has been confirmed. Furthermore, the definition of low-voltage zone is still controversial, and bipolar voltage amplitudes depend on multiple variables including electrodes orientation relative to direction of wavefront, electrode length, interelectrode spacing, and tissue contact. The aim of this article is to review the role and limitation of voltage mapping, and to share our initial experience of a newly released grid-pattern designed mapping catheter to make the voltage mapping more reliable to guide patient specific AF ablation.
Key Words : atrial fibrillation, catheter ablation, fibrosis, low voltage.
Correspondence to: Takanori Yamaguchi, Department of Cardiovascular medicine, Saga University, 5-1-1 Nabeshima, Saga, 849-8501, Japan.
The initiation and maintenance of atrial fibrillation (AF) requires triggers and an atrial substrate, and AF often progresses from trigger-driven arrhythmias to more substrate-dependent arrhythmia. Haissagurre et al [1] demonstrated in their seminal work that ectopic beats from the pulmonary vein trigger AF, and thereafter, electrical isolation of the PV has been developed as a cornerstone therapy for AF ablation. [2] However, pulmonary vein isolation (PVI) alone has demonstrated a 60 to 80 % of sinus rhythm maintenance rate in paroxysmal AF and 50 to 60 % in non-paroxysmal AF patients. [2,3] To improve the outcomes, several techniques to modify atrial substrate has been vigorously developed especially in non-paroxysmal AF patients. Linear ablation and ablation of complex fractionated electrograms have been recognized as a conventional substrate modification.[2] However, the STAR-AF II trial (Substrate and Trigger Ablation for Reduction of Atrial Fibrillation Trial Part II) demonstrated no reduction in AF recurrence rate when either empirical linear ablation or ablation of complex fractionated electrograms was performed in addition to PVI.[3] This study suggests that more patient-specific substrate modification is needed to improve ablation outcomes.
Atrial fibrosis and atrial fibrillation
AF is associated with structural, electrical, and contractile remodeling of the atria. Development and progression of atrial fibrosis are the hallmark of structural remodeling and are considered to be the substrate for AF perpetuation. [4] Shortening of action potential duration characterize electrical remodeling. Animal models of AF demonstrated early recovery of electrical remodeling after sinus rhythm restoration, [5] however, structural remodeling has been suggested to persist in the long term. [6] At sites of atrial fibrosis, collagen deposition and proliferation of fibroblast and myofibroblasts arises. Atrial fibrosis produces the substrate to promote AF by interrupting fiber bundle continuity, causing local conduction disturbances, and promoting anisotropic conduction. [7] AF is also facilitated by shortening of action potential duration resulting from the electrophysiological effects of fibroblasts and myofibroblasts. [8] In addition, myofibroblasts are also known to elicit ectopic activity, potentially providing triggers for reentry formation. [9] Human histology data show that increased amounts of atrial fibrosis are found in the atria of AF patients. [10-13] In post-mortem atrial tissues, the amount of atrial fibrosis was significantly correlated with presence of AF and duration of arrhythmia. [11] Even in patients with lone paroxysmal AF, atrial septal biopsies have revealed inflammatory infiltrates consistent with myocarditis and fibrosis. [12] These experimental and clinical studies proved a positive correlation between atrial fibrosis and AF.
Accurate and reliable detection and quantification of atrial fibrosis could help to choose an appropriate strategy for treatment of AF. Late gadolinium enhancement magnetic resonance imaging (LGE-MRI) has been developed to visualize and quantify extent of atrial fibrosis, [14,15] providing indirect evidence of fibrosis in the left atrium. Although significant advancements have been made in this technology, many significant controversies and limitations remain, including limited spatial resolution to detect fibrotic tissue in thin atrial wall coupled with motion or flow artifact, non-reproducibility in different centers, high inter-observer variability, and no standardized image acquisition protocols and image processing techniques. [16] Furthermore, LGE-MRI is available only in limited research centers. Another method to estimate fibrotic burden in atria is peak-to-peak bipolar voltage mapping using three-dimensional electroanatomic mapping (EAM) systems, which have been developed and widely used in clinical practice to guide ablation and mapping catheters. EAM identifies and quantifies the presence of low-voltage zone (LVZ) in the atria, the amount of which is strongly related to AF recurrence after PVI. [17,18]
Definitions of low-voltage zone in the atria
The primary mechanism of a low-voltage electrogram has been suggested to be atrial fibrosis. Low-voltage electrograms have been reported to come from diverse mechanisms [19-22] and may reflect poor tissue coupling, discontinuous conduction, and non-uniform anisotropic tissues caused by fibrosis. However, no direct correlation between histological fibrosis and LVZ has been confirmed. The definition of LVZ still remains controversial, mainly due to lack of histological examination. Sanders et al [24,25] created electroanatomical maps of the RA either with distal coronary pacing or in sinus rhythm in their work to investigate electrophysiological substrate in the right atrium (RA) for AF in humans with congestive heart failure and sinus node diseases. In this work, they initially characterized electrically silent areas (scar) defined by the absence of recordable activity or a bipolar voltage amplitude ≤0.05 mV; and low-voltage areas defined by contiguous areas of bipolar voltage ≤0.5 mV. Based on these reports, Verma et al. [17] defined pre-existent left atrial scarring as an absence of voltage or a bipolar voltage amplitude ≤0.05 mV and low-voltage “abnormal” areas as an amplitude ≤0.5 mV recorded during sinus rhythm. This seminal work first demonstrated that pre-existent left atrial scarring, identified by electroanatomic mapping, is a strong independent predictor of recurrence after PVI. Subsequently, Lo et al. [26] also defined LVZ as ≤0.5 mV based on the report by Sanders et al., in their work investigating progressive remodeling of the atrial substrate in patients with AF recurrence after AF ablation. The same group [27] also investigated biatrial substrate properties in AF patients using the same definition of “scar” and LVZ as report by Verma et al. [17] Thereafter, the cut-off value of 0.5 mV for the definition of LVZ has been historically used by other researchers.
However, electrophysiological and histological evidence of the cut-off value for the definition of LVZ has been still lacking. Miyamoto et al. [28] reported that the local conduction through the LVZ defined as <0.5 mV during sinus rhythm was significantly delayed compared with that through the non-LVZ. On the other hand, the local conduction through the LVZ defined as 0.5–0.75 or 0.75–1.0 mV was similar to that through the non-LVZ. In addition, a complex electrogram morphology of fractionated or double potentials was more frequently found in the LVZ defined as <0.5 mV compare with the non-LVZ. These findings suggest that the LVZ defined as <0.5 mV would reflect region with significant fibrosis which cause slow conduction due to interruption of fiber bundle continuity. [29] Masuda et al [30] reported that LVZs defined as < 0.5 mV are associated with high inducibility of atrial tachyarrhythmias after PVI, suggesting LVZ defined as < 0.5 mV works as arrhythmogenic substrate.
Clinical evidence of the impact of LVZ defined as <0.5 mV during sinus rhythm on outcomes after PVI also has been reported. Yamaguchi et al. [18] compared the long-term outcomes after PVI alone in patients with LVZs defined as <0.5 mV and those in patients without LVZs. An atrial tachyarrhythmia free-survival rate after PVI alone was significantly lower in patients with LVZs, and the extent of the LVZ was identified to be an independent risk factor of AF recurrence after PVI alone. Masuda et al. [31] also revealed that the presence of LVZ defined as <0.5 mV predicts AF recurrence in patients with paroxysmal AF as well as those with persistent AF. Lin et al [32] established the definitions of LVZ as 0.1-0.4 mV and transitional zone (TZ) as 0.4-1.3 mV. In their study, 13 patients without any cardiovascular risk factors, who were supposed to have “normal” LA, were analyzed. In this population, 95% of all bipolar electrogram signals were >0.38 mV. Therefore, the upper limit cutoff of the LVZ was defined as 0.4 mV. In patients with persistent and long-standing AF, 95% of complex electrograms defined as ≥three positive or negative distinct peaks and electrogram duration ≥50 ms were distributed in areas with the bipolar voltage <1.32 mV. As such, the transitional zone was defined as bipolar voltage between 0.4 and 1.3 mV. Chen, one of the authors, described in his nice review article regarding scar homogenization, “Theoretically speaking, diseased atria are not only “black and white” with a clear line; therefore, setting LVZ as the profound scar and TZ as the moderate fibrotic area is more reasonable.” [33]. Vlachos et al [34] also reported that the existence of LVZ in the LA defined as <0.4 mV more than 10% of the total LA surface area, detected through high density voltage mapping (median number of 2,485 points), predicts arrhythmia recurrence after PVI for paroxysmal AF using defined as <0.4 mV.
Oakes et al [13] described the utility of delayed-enhancement MRI in detecting fibrosis in the LA, and reported that an increased amount of LA wall enhancement is strongly associated with recurrence after PVI. The researchers also confirmed a good correlation between enhancement on LGE-MRI and low-voltage regions defined as <0.5 mV on electroanatomic map (R2 = 0.61). Subsequently, the same group provided histological evidence of fibrotic remodeling based on 14 surgical biopsy specimens taken from nine patients with AF and one non-AF patient. LA wall biopsies demonstrating tissue fibrosis were correlated with regions of LA wall enhancement on LGE-MRI, whereas normal biopsy tissue matched with non-enhanced regions, suggesting the accuracy of LGE-MRI in detecting fibrosis. The DECAAF multicenter, and prospective study demonstrated that among patients with AF undergoing AF ablation, atrial fibrosis estimated by LGE-MRI was independently associated with the likelihood of AF recurrence. [15] Several studies comparing EAM derived low-voltage areas and LGE-MRI have been reported. Lim et al. summarized the relationship between voltage map and DE-MRI in their editorial comment, however, the threshold of bipolar voltage and DE-MRI methodology are heterogeneous. [35]
Spatial distribution of LVZ, LGE, and fibrosis
LVZs defined as < 0.5 mV during SR are identified about 30% in patients with persistent AF [18,36,37] and 15% in patients with paroxysmal AF [31]. We categorized patients into Stage I to Stage IV according to the extent of %LVZ ([Figure 1]), and reported that LVZ extent is still a strong predictor for recurrence even after LVZ homogenization. [37] The spatial distribution of LVZs is related to the extent of LVZ. LVZs were most frequently identified at the anterior wall, septum, and roof, and posterior wall. However, LVZs were less frequently identified at the inferior wall and lateral wall. Only patients with extensive LVZ (Stage IV) have LVZs at the inferior and lateral wall ([Figure 2]). On the other hand, Higuchi et al. [38] from Utah group reported that LGE was most frequently identified in the lateral, inferior, and posterior wall. There is a great discrepancy in spatial distribution of LGE by DE-MRI and LVZ. From histological perspective, Platonov et al [11] reported that in postmortem atrial tissue analysis, the extent of fibrosis did not differ among the 5 sampling locations in the atria including crista terminalis, Bachmann’s bundle, inferior PV, posterior LA, superior PV. Although anterior wall and atrial septum, which is most frequent site of LVZ, was not examined, this study proved that fibrosis progression is more ubiquitous process. Schreiber et al. recently reported that the success rate of PVI and box isolation of fibrotic area (BIFA) was lower in severe fibrotic atrial cardiomyopathy (FACM class III and IV) than in mild-to-moderate FACM (class I and II), which is consistent with our study. Furthermore, the maximum LA voltage reduced over the FACM classes, which is consistent with the histological examination report by Platonov et al. [11] Because both voltage mapping and DE-MRI have important limitations in imaging for atrial fibrosis, histological validation is necessary to reveal the relationship between fibrosis extent and specific spatial distribution in LVZ and LGE.
Figure 1
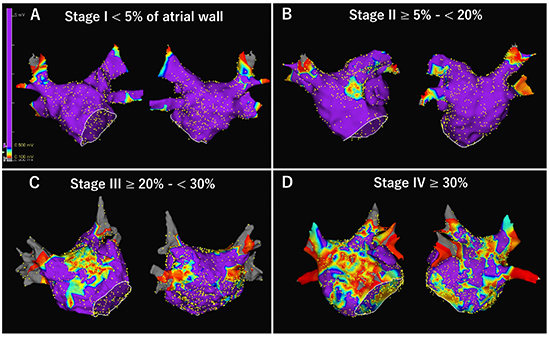
Four stages of left atrial (LA) low-voltage zone (LVZ). After obtaining LA and pulmonary vein geometry, high-density bipolar voltage map was created during sinus rhythm using a 20-pole circular mapping catheter with a 1-mm electrode length and 2-mm interelectrode spacing (Reflexion HDTM; Abbott). LVZ and electrical scar was defined as < 0.5 mV and < 0.1 mV during sinus rhythm, respectively. Total %LVZ area was calculated as the percentage of LA surface area excluding the PV antral region, LAA orifice, and mitral valve, and LVZ was subsequently categorized as stage I (<5%), II (≥5% to <20%), III (≥20% to <30%), and IV (≥30%) according to previous publication. [37]
Figure 2
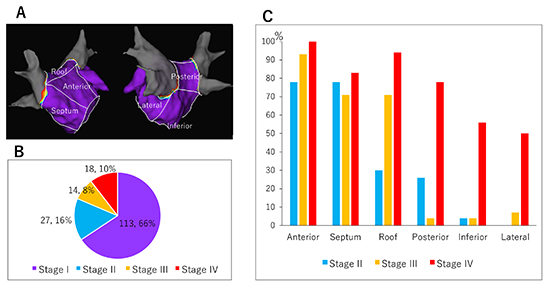
Spatial distribution of left atrial (LA) low-voltage zone (LVZ). (A) LA was divided into six segments (anterior, septal, roof, posterior, inferior, and lateral wall) to describe LVZ distribution. (B) Percentage of patients classified into each stage among 172 persistent patients were shown. (C) Spatial distribution of LVZ in each stage. LVZ was frequently identified in the anterior wall, septum, and roof in Stage II and III. LVZs at inferior and lateral wall were less frequent and identified almost exclusively in patients in Stage IV (extensive LVZ). Graphs are created from the data in the previous publication (supplementary [Table 1], Yamaguchi et al. J Cardiol. 2018; 72: 427-433.)
Efficacy of Voltage-based AF ablation
Improved outcomes may be possible with patient-specific substrate modification targeting atrial fibrosis as estimated by voltage mapping. Recently, there is increasing evidence of the efficacy of voltage-based AF ablation predominantly in non-paroxysmal AF patients. [36,37,39-45] The hypothesis is that performing substrate ablation, based on the individual patient’s location and extent of LVZ, in addition to PVI would improve outcomes, while no substrate modification would be necessary in patients without LVZ. However, most studies were small and/or non-randomized observational assessments. Recently, Yang et al. [46] reported the results of a multicenter, randomized study that compared substrate modification targeting LVZ and conventional stepwise approach after PVI and found similar success rates at 18 months, with lower procedure and fluoroscopy durations and shorter energy delivery time in the former group. Importantly, over 50% of nonparoxysmal AF patients did not need further ablation beyond PVI, which is consistent with the previous study results. [36,37,39-45] Kircher et al [47] also reported the efficacy of voltage-guided ablation in a randomized single-center study. A large, multicenter randomized trial, START Trial (Substrate Targeted Ablation of Persistent Atrial Fibrillation Trial) designed to assess the safety and efficacy of left atrial voltage-based ablation (PVI plus LVZ homogenization Vs. PVI alone in patients with LVZ), is ongoing (https://www.umin.ac.jp/ctr/index.htm, UMIN000022119 ), which will provide further insight into this strategy. [Figure 3] shows an example of homogenization of LVZ identified during sinus rhythm. Jadidi et al [42] and Yagishita et al [48] defined LVZ as <0.5 mV during AF, and reported the efficacy of voltage-based ablation based on the definition. However, bipolar voltage depends on the direction and complexity of the wavefront propagation. Therefore, an accurate measurement of the bipolar voltages during AF may be challenging due to the temporal variation in the voltages.
Figure 3
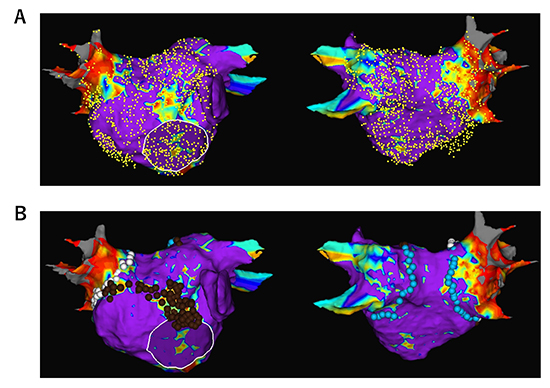
An example of newly appeared low-voltage zone (LVZ) in a 76-old-year male during a redo procedure for recurrence of persistent AF. A left atrial (LA) voltage map was created using a circular mapping catheter during sinus rhythm. No prior substrate ablation was performed and no LVZ was identified at the index procedure 2 years prior. LVZ was identified at the anterior wall and the septum. Pulmonary vein (PV) reconnection was also identified in the left inferior PV. LVZ homogenization at the anterior wall and septum, as well as wide antral PVI, was performed. To prevent atrial tachycardia due to a narrow isthmus between the homogenized area and PVI line, strategic linear lesions were placed to create an anterior mitral line.
Limitations of voltage map
It is important to consider which factors determine bipolar electrogram amplitude. Bipolar electrograms are the difference in voltage between two unipolar electrograms that are recorded at two closely spaced electrodes, providing sharp and high frequency signals, and used as a good indicator of local timing of near field. However, there are many variables that can influence the electrogram amplitude. Anter and Josephson nicely summarized those variables in their editorial commentary. [49] The variables are (1) activation vector; (2) angle of incidence; (3) recording electrode size; (4) interelectrode spacing; (5) tissue contact; (6) filtering; (7) mapping density; (8) mapping resolution. Voltage map during sinus rhythm changes in response to the change of activation wavefront. [Figure 4] shows an example of influence of activation direction on bipolar voltage map and wave propagation. [50] The voltage map was created by circular mapping catheter (CMC) during sinus rhythm. An LVZ defined as <0.5 mV was identified at the anterior wall and conduction delay was also observed through the LVZ, while the LVZ and conduction delay disappeared during CS pacing, suggesting unidirectional block at the LVZ.
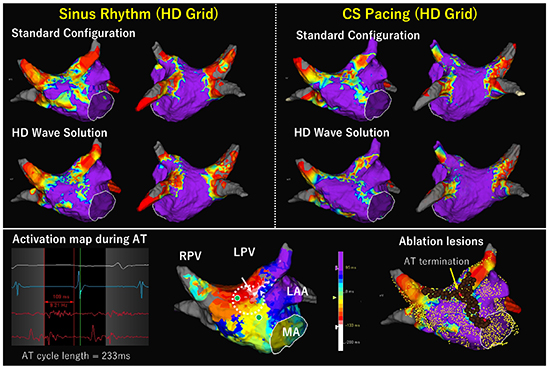
Figure 4
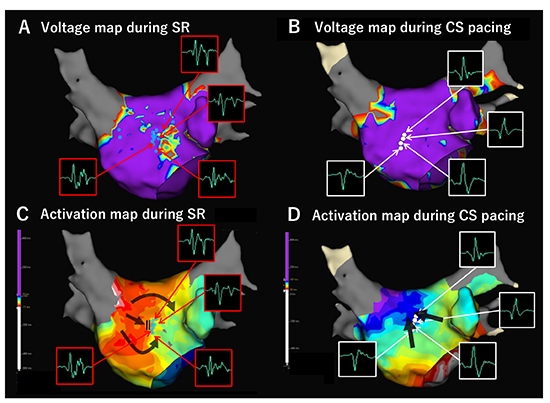
Activation direction of wavefront influences bipolar voltage and conduction velocity. Left atrial (LA) voltage map was created using circular mapping catheter (CMC, Reflexion HD) both during sinus rhythm (SR) and distal coronary sinus (CS) pacing in a patient with persistent AF. LVZ defined as <0.5 mV was identified at the anterior wall during SR (A), while it disappeared during CS pacing (B). Conduction block and/or delay as well as fractionated potentials observed during SR along the LVZ disappeared during CS pacing (C, D). Figure modified from Fukui A. et al. Heart Rhythm, S322, Vol. 15, No. 5, May Supplement 2018.
A New HD Grid mapping catheter in voltage mapping
Dependence of the orientation of electrode catheters relative to the propagating wavefront is one of most important disadvantage of bipolar recordings. [49,50] When the activation wavefront moves parallel to the electrode pair, there is a maximum difference between the unipolar electrogram recorded for the distal and the unipolar electrogram recorded for the proximal electrode, which results in maximum bipolar amplitude between the two electrodes. On the other hand, when the activation wavefront moves perpendicular to the electrode pair, both electrodes record the similar unipolar signals. Therefore, there will be minimum to no difference in the unipolar signals, resulting in a bipolar electrogram that may cause a false low-voltage.
A recently released AdvisorTM HD Grid mapping catheter (HD Grid, Abbott) has a unique grid-pattern design, consisting of 16 electrodes of 1-mm length across 4 splines with equidistant 3-3-3 mm spacing allowing bipole recording along and across the splines ([Figure 5]). This mapping catheter was designed to reduce the variability in bipolar electrogram characteristics associated with different orientations of the electrodes relative to the wavefront. Bipolar electrograms both along and across the spline can be recorded. The potential of this catheter can be maximized when used in conjunction with the EnSite PrecisionTM System Best Duplicate algorithm. When multiple points are obtained within every 1 mm sphere of space, this algorithm selects mapping point with the largest voltage and with timing near the timing average. In addition, the HD Wave Solution accounts for directionality taking voltage recordings only from orthogonal bipoles and only keeping the highest amplitude point. Multiple configurations are possible, at our center we leveraged a configuration that collected 9 Best Duplicates for each saved map point.
[Figure 6] shows a good example of difference in bipolar voltage amplitude with different electrodes orientation relative to activation direction. Some of bipoles of the CMC were placed perpendicular to the wavefront and the bipolar amplitude was very low (0.05 mV). On the other hand, when HD Grid was placed at the same position and the bipoles along the spline were parallel to the wavefront, the bipolar amplitude was normal (1.79 mV). LVZ at the right atrial posterior wall identified using the CMC disappeared when HD Grid was used.
[Figure 7] and [Figure 8] show comparisons of voltage maps during sinus rhythm between CMC and HD Grid catheters in different patietns. [Figure 9] shows voltage maps in a redo session of the patient represented in [Figure 8]. In both cases, HD Grid decreased the extent of LVZ. Importantly, conduction delay or block was observed along the LVZ identified by HD Grid. For the patient in [Figure 8] and [Figure 9], the LVZ at the anterior wall was revealed to be a cause of atrial tachyarrhythmia recurrence. [Figure 10] shows comparison of voltage map during AF and high RA pacing. In this comparison, HD Grid drastically reduced the extent of LVZ during AF. These examples suggest that HD Grid can overcome directional sensitivity and can exclude false low-voltage, and can detect AF substrate more accurately, which leads to more effective voltage-based ablation strategy, although difference in interelectrode spacing may influence the voltage amplitudes and clinical studies are needed to evaluate the clinical impact of this technology.
Figure 5
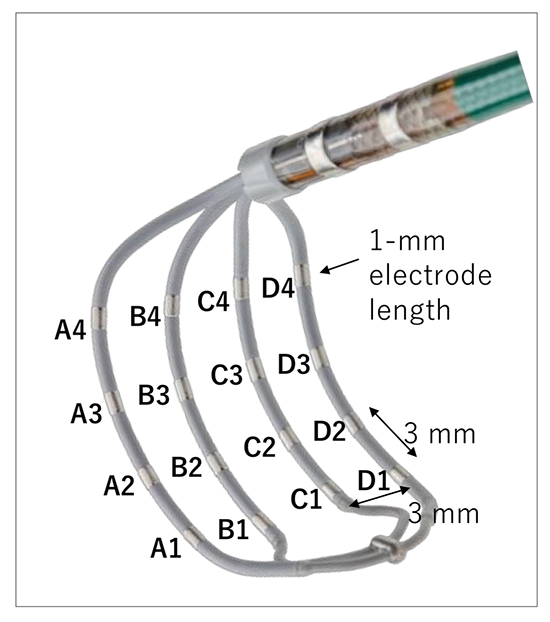
Electrode configuration of a mapping catheter with grid-patterned design (AdvisorTM HD Grid Mapping Catheter, Abbott)
Figure 6
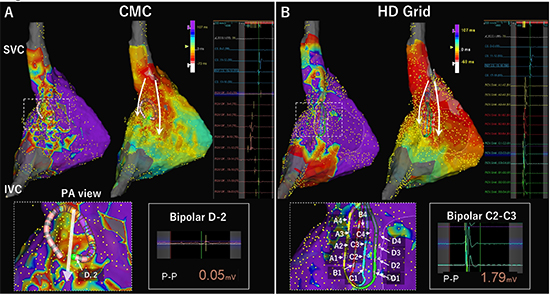
Difference in bipolar voltage amplitude with different electrode orientation relative to activation direction. Right atrial (RA) bipolar voltage maps during sinus rhythm were compared between a conventional circular mapping catheter (CMC) with a 1-mm electrode length and 1-mm interelectrode spacing (InquiryTM OptimaTM; Abbott) and a mapping catheter with grid-patterned design (AdvisorTM HD Grid Mapping Catheter, Abbott). Low-voltage zone (LVZ) and scar was defined as <0.5 mV and <0.1 mV during sinus rhythm, respectively. The internal and external projection of the geometry’s electrical information was strictly set at 4 mm, and mapping catheters were introduced via a steerable long sheath (AgilisTM, Abbott). Bipolar electrograms were filtered by a band pass to frequencies between 30 to 500 Hz. Timing of local activation was automatically set at the initial deflection using EnSite PrecisionTM System. (A) A LVZ was identified at the RA posterior wall along the crista terminalis when a 20-pole CMC used. White arrows in the activation maps show the activation direction. The enlarged map shows the electrode orientation relative to activation direction. The bipolar D-2 was placed perpendicularly to the wavefront, and the bipolar signal shows a peak-to-peak amplitude of 0.05 mV. (B) The LVZ disappeared when the HD Grid catheter was used. In this map, all bipole pairs along spline only (12 pairs) were used (so-called Standard configuration). Electrode numbers of the HD grid were shown in the enlarged map. In this position, all of the bipolar pairs were placed parallel to the wavefront. The bipole C2-C3 located at the same position with bipolar D-2 of the CMC in figure A shows an amplitude of 1.79 mV. Note that activation sequence map is also more organized in the HD grid map compared to the CMC map probably because of more accurate detection of initial deflection due to higher amplitudes in the HD grid map.
Figure 7
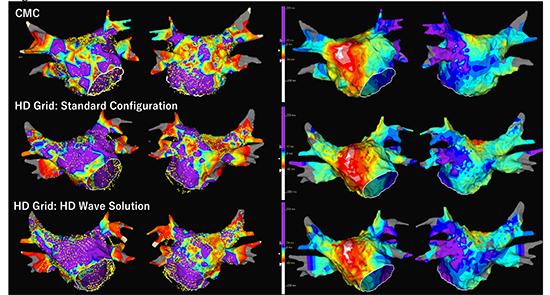
A comparison of voltage maps obtained during sinus rhythm between a circular mapping catheter (CMC, Reflexion HD) and a HD grid catheter in a 65 year old male with paroxysmal AF. No prior ablation was performed. Geometry creation and voltage mapping of the LA was separately performed during sinus rhythm (SR) using CMC and HD Grid. Voltage map by CMC shows extensive low-voltage zones (LVZs) at the anterior wall, septum, and roof, and the posterior wall (46% of LA surface) (Upper panel). Another voltage map was created by HD Grid during SR. Standard Configuration map using all bipole pairs down the splines only with 12 bipolar sets shows decrease of LVZ extent to 31% of LA surface, especially at the anterior wall (middle panel). Interestingly, the HD Wave Solution using only orthogonal bipoles further decreased the LVZ extent to 18%. Of note, the LVZ at the anterior wall completely disappeared. Activation sequence maps show no obvious conduction slowing at the anterior wall, septum and roof, while conduction delay and/or block was suggested at the posterior wall close to left inferior pulmonary vein where LVZ was consistently identified in all the three maps.
Figure 8
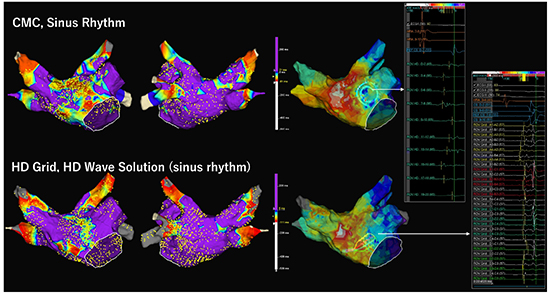
A comparison of voltage maps during sinus rhythm (SR) between a circular mapping catheter (CMC) and a HD grid catheter in a 75 year old female with persistent AF. No prior ablation was performed. Voltage map of the LA was separately created during SR using CMC and HD Grid. LVZ was defined as <0.5 mV and scar as <0.1mV. Voltage map by CMC shows extensive low-voltage zones (LVZs) at the anterior wall, septum, and the roof (20% of LA surface) (Upper panel). Another voltage map created by HD grid using HD Wave Solution shows smaller extent of LVZ (9% of LA surface). Activation sequence maps show conduction slowing at the sites with LVZ detected by HD Grid in both maps. Bipolar electrograms obtained by each mapping catheter at the slow conduction zone were shown. This patient underwent pulmonary vein isolation alone in the first session.
Figure 9
A comparison of voltage maps between during sinus rhythm (SR) and during distal coronary sinus pacing (CS pacing) both created by HD Grid catheter in a 75 year old female with cardioversion and drug refractory repeated recurrent atrial tachycardia (AT). This is the same patient described in [Figure 8]. No prior substrate ablation was performed in the index procedure. Redo procedure was performed 30 days after the index procedure. Voltage mapping of the LA was separately performed using HD Grid during SR and during CS pacing. LVZ was defined as <0.5 mV and scar as <0.1mV. The upper left panel shows voltage maps during SR with Standard Configuration and with HD Wave Solution. The upper right panel shows voltage maps during CS pacing with Standard Configuration and with HD Wave Solution. Voltage map during CS pacing shows less LVZ extent than that during SR both in Standard Configuration and HD Wave Solution. In addition, the voltage map during SR with HD Wave Solution was comparable to that during the index procedure ([Figure 8]) except for pulmonary vein antral lesions. Lower panel shows activation sequence map during AT (cycle length 233ms), which revealed counter-clockwise rotation at the anterior wall. Post-pacing interval was identical to the AT cycle length at the sites with green dot. The AT was successfully terminated at the site indicated by the yellow arrow and red tag, which showed continuous fractionated potential lasting 109 ms. Thereafter, perimitral AT and roof reentrant AT were also induced. LVZ homogenization resulted in creation of anterior mitral isthmus line and roof line. A conduction gap identified at the anterior carina of left superior pulmonary vein was also ablated. Finally, non-inducibility of any tachycardia during isoproterenol infusion was confirmed.
Figure 10
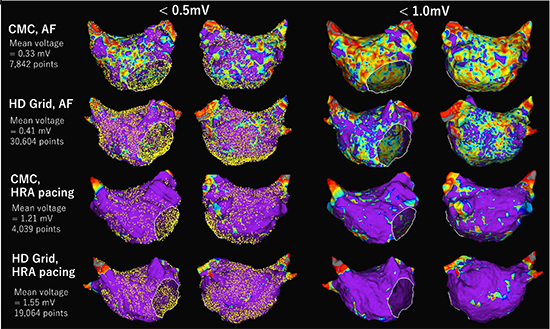
Comparison of high-density voltage map in the left atrium (LA) during atrial fibrillation (AF) and high right atrium (HRA) pacing using circular mapping catheter (CMC) and a grid mapping catheter in a different voltage threshold of <0.5mV and <1.0mV in a 63 years old male with long-lasting persistent AF. For voltage mapping during AF, a peak-to-peak bipolar voltage was collected in a roving acquisition time interval of AF cycle length (160 ms) using HD Wave Solution, and ultra-high-density mapping was performed for 10 minutes for each voltage map. Using CMC, about 8,000 mapping points were obtained. With the threshold of <0.5 mV, LVZ was observed diffusely but predominantly in the anterior wall. With the threshold of <1.0 mV, the whole LA was covered by LVZ. On the other hand, using HD Grid, over 30,000 mapping points were acquired in the same mapping time (10 minutes). Only limited LVZ was observed at the posterior wall at the threshold of <0.5 mV, and diffuse but less extent of LVZ was observed at <1.0mV compared to CMC. The mean voltage was higher in the HD Grid map (0.41 ± 0.28 mV vs. 0.33 ± 0.14 mV). Voltage map during HRA pacing (120 beats per minute) at the site close to sinus node was also created. With the threshold of <0.5 mV, LVZ was not identified using both CMC and HD grid. With the threshold of <1.0 mV, only patchy LVZs were identified in both mapping catheters. The mean voltage during HRA pacing was also higher in the HD Grid map (1.56 ± 0.80 mV vs. 1.21 ± 0.19 mV).
Patient specific substrate ablation targeting fibrotic tissue estimated by bipolar voltage mapping is a promising alternative strategy for additional substrate modification beyond PVI, although more clinical evidence should be accumulated. However, consideration must be given to the fundamental mechanism and potential limitations of bipolar voltage mapping. Dependence of the orientation of electrode pairs on the catheter relative to the wavefront is one of the most important disadvantages. Our initial experience of a newly developed grid-pattern designed mapping catheter may overcome this limitation and make the voltage map more accurate, thereby impacting ablation strategies; however, further studies are needed.


