Atrial Fibrillation is a Risk Factor for Worse Outcomes in Patients with End Stage Liver Disease
Zia Khan Muhammada, U. Khan Muhammada, U. Khan Safia, Alharbi Anasa, Osman Mohammedb, Pratik Agrawalb, Mina M. Benjaminb, Kinjan Patelb, Sudarshan Ballab, Bilal Munir Muhammadbc
aDepartment of Medicine, West Virginia University, Morgantown, WV, USA.bDivision of Cardiovascular Medicine, West Virginia University Heart and Vascular Institute, Morgantown, WV, USA.cSection of Electrophysiology, Division of Cardiovascular Medicine, University of California San Diego, La Jolla, CA, USA.
Liver disease is a risk factor for development of atrial fibrillation (AF). We aim to study inpatient mortality and resource utilization of end-stage liver disease (ESLD) patients with AF from a nationally representative United States population sample.
For the purpose of our study, we utilized data from National Inpatient Sample for calendar years 2005-2015. Patients with ESLD and AF were identified using relevant International Classification of Disease, Ninth Revision, Clinical Modification (ICD-9-CM) codes. Key outcomes of inpatient mortality and resource utilization were assessed. We also constructed a multiple logistic regression model to determine predictors of mortality in ESLD patients. Propensity matching was also done to balance confounding variables.
A total of 309,959 ESLD patients were included in final analysis. Out of these, about 32,858 (10.6%) patients have concomitant AF. ESLD patients with AF were older and had higher burden of key co-morbidities such as heart failure, diabetes and hypertension. Mortality was significantly higher in both unmatched (12.3% vs. 9.2%, p < 0.01) and matched cohorts (12.2% vs. 10.8%, p < 0.01). Additionally, ESLD patients with AF have longer length of stay, increased facility discharge and cost of hospitalization compared to ESLD patients with out AF. In multivariate analysis, AF is an independent predictor of mortality in ESLD patients.
AF portends worse outcomes in patients with ESLD. Strong index of suspicion is warranted to timely identify AF in this patient population.
Key Words : Atrial fibrillation, End-stage liver disease, Outcomes.
End stage liver disease (ESLD) is a global health burden and one of the leading causes of mortality around the world [1],[2]. Majority of ESLD patients frequently get admitted to hospital due to related complications of hepatic encephalopathy, spontaneous bacterial peritonitis (SBP) and gastrointestinal bleeding [3]. ESLD is also associated with autonomic dysfunction and increase levels of circulating neuropeptides such as vasoactive intestinal peptide (VIP) and galactin-3 [4],[5],[6]. These physiological perturbations are proposed in pathogenesis of atrial fibrillation (AF) in ESLD patients [7]. Studies have shown that ESLD is a predictor for new onset AF with advanced ESLD as manifested by worsening Model for End-Stage Liver Disease (MELD) score associated with further increased risk [8]. Till to date, there is no data on how AF affects inpatient outcomes of ESLD patients who are at greatest risk for frequent hospitalizations. In this paper, we aim to study these parameters from a national United States population database.
Data were collected from National Inpatient Sample (NIS). NIS is part of Healthcare Cost and Utilization Project (HCUP) databases and is made possible by a Federal-State-Industry partnership sponsored by the Agency for Healthcare Research and Quality (AHRQ). The NIS is derived from all States for national estimates of healthcare utilization, cost and outcomes [9]. Since NIS is compiled annually, the data can be used for analysis of disease trends over time. The study was deemed exempted from Institutional Review Board approval given the de-identified nature of the NIS database and public availability.
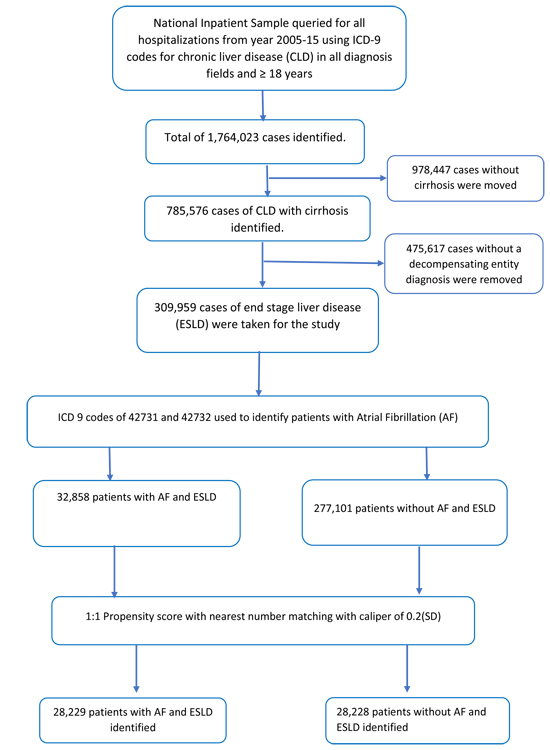
We analyzed NIS database from January 2005 to August 2015 using the International Classification of Diseases, 9th Revision, Clinical Modification (ICD-9-CM) codes. Patients ≥ 18 years of age were included. Patients with ESLD were identified using Goldberg’s third algorithm [10], a well-validated method for identifying ESLD from administrative datasets, generating a positive predictive value of 89.3%. Based on this algorithm, first ICD-9-CM codes were used to select chronic liver disease patients. (ICD-9-CM of 070.20-21, 070.23, 070.30-33, 070.40, 070.42, 070.49, 070.52, 070.59-60, 070.70-71, 070.90, 571.1, 571.40-41, 571.8, and 571.9), then a concurrent diagnosis code of cirrhosis was added (ICD-9-CM of 571.2, 571.5 or 571.6) and finally at least 1 concurrent diagnostic code for hepatic decompensation event (ICD-9-CM of 456.0-2, 789.5, 789.59, 572.2, 567.2, 567.21, 567.29, 567.8-9 or 572.4). Using this algorithm, we were able to extract a total of 309,959 ESLD patients that were included in final analysis. Please see [Figure 1] for detailed methodology of patient inclusion criteria.
Figure 1. Flow sheet of our paper
Baseline characteristics and hospital outcomes were derived and compared among ESLD patients with and without AF. To account for potential confounding factors and selection bias, a propensity score-matching model was developed using logistic regression to derive two matched groups for comparative outcomes analysis. A nearest neighbor 1:1 variable ratio, parallel, balanced propensity-matching model was made using a caliper width of 0.2. Descriptive statistics were presented as frequencies with percentages for categorical variables and as means with standard deviations for continuous variables. Baseline characteristics were compared using a Pearson𝜒2 test and Fisher's exact test for categorical variables and independent samples t-test for continuous variables.
Logistic regression was performed to estimate odds ratios (ORs) with 95% confidence intervals (CIs) to determine predictors of mortality in ESLD. Initially, binomial logistic regression model was used to identify variables from demographic data [Table 1] that were significantly associated with patient mortality (P value ˂ 0.10). These variables were then subsequently utilized in a multiple logistic regression model to identify predictors of mortality. A type I error rate of <0.05 was considered statistically significant. All statistical analyses were performed using statistical package for social science (SPSS) version 26 (IBM Corp) and R 3.5 for propensity matching
Table 1. Baseline characteristics of the study population
| Variable |
Decompensated CLD† patients without atrial fibrillation (n=277,101) |
Decompensated CLD† patients with atrial fibrillation (n=32,858) |
All Decompensated CLD† patients (n=309959) |
P value |
| Age (mean [SD]) years |
58.14(12) |
68.46(11.8) |
59.23(12.4) |
<0.01 |
| Female |
104775(37.8%) |
11498(35%) |
116273(37.5%) |
<0.01 |
| Race |
|
|
|
|
| Caucasian |
161236(65%) |
21996(73.9%) |
183232(66%) |
<0.01 |
| African American |
25435(10.3%) |
2895(9.7%) |
28330(10.2%) |
<0.01 |
| Hispanics |
44713(18%) |
3215(10.8%) |
47928(17.3%) |
<0.01 |
| Asian or Pacific Islander |
5431(2.2%) |
722(2.4%) |
6153(2.2%) |
<0.01 |
| Native American |
3532(1.4%) |
188(0.6%) |
3720(1.3%) |
<0.01 |
| Medical comorbidity |
|
|
|
|
| Acquired immune deficiency syndrome |
1920(0.7%) |
80(0.2%) |
2000(0.6%) |
<0.01 |
| Alcohol abuse |
108711(39.2%) |
8564(26.1%) |
117275(37.8%) |
<0.01 |
| Anemia (chronic blood loss) |
13485(4.9%) |
1261(3.8%) |
14746(4.8%) |
<0.01 |
| Anemia (Deficiency anemia) |
83965(30.3%) |
11119(33.8%) |
95084(30.7%) |
<0.01 |
| Collagen vascular diseases |
5393(1.9%) |
644(2%) |
6037(1.9%) |
0.865 |
| Congestive heart failure |
25819(9.3%) |
10260(31.2%) |
36079(11.6%) |
<0.01 |
| Chronic pulmonary disease |
48075(17.3%) |
8940(27.2%) |
57015(18.4%) |
<0.01 |
| Coagulopathy |
107493(38.8%) |
10294(31.3%) |
117787(38%) |
<0.01 |
| Diabetes uncomplicated |
70187(25.3%) |
9821(29.9%) |
80008(25.8%) |
<0.01 |
| Diabetes with chronic complications |
16417(5.9%) |
2839(8.6%) |
19256(6.2%) |
<0.01 |
| Drug abuse |
20523(7.4%) |
993(3%) |
21516(6.9%) |
<0.01 |
| Hypertension (combine uncomplicated and complicated) |
111152(40.1%) |
17685(53.8%) |
128837(41.6%) |
<0.01 |
| Hypothyroidism |
27026(9.8%) |
5408(16.5%) |
32434(10.5%) |
<0.01 |
| Lymphoma |
2120(0.8%) |
366(1.1%) |
2486(0.8%) |
0.11 |
| Fluid and electrolyte disorders |
125123(45.2%) |
15859(48.3%) |
140982(45.5%) |
<0.01 |
| Metastatic cancer |
5567(2%) |
594(1.8%) |
6161(2%) |
0.13 |
| Neurological disorders |
18870(6.8%) |
2108(6.4%) |
20978(6.8%) |
<0.12 |
| Obesity |
22290(8) |
3912(11.9%) |
26202(8.5%) |
<0.01 |
| Peripheral vascular disorders |
10755(3.9%) |
2998(9.1%) |
13753(4.4%) |
<0.01 |
| Pulmonary circulation disorders |
8098(2.9%) |
2969(9.0%) |
11067(3.6%) |
<0.01 |
| Renal failure |
47511(17.1%) |
11568(35.2%) |
59079(19.1%) |
<0.01 |
| Solid tumor without metastasis |
13274(4.8%) |
1380(4.2%) |
14654(4.7%) |
<0.01 |
| Peptic ulcer disease |
224(0.1%) |
26(0.1%) |
250(0.1%) |
0.918 |
| Valvular disease |
9236(3.3%) |
4007(12.2%) |
13243(4.3%) |
<0.01 |
| Weight loss |
35185(12.7%) |
4209(12.8%) |
39394(12.7%) |
0.564 |
| Associated diagnosis |
|
|
|
|
| Acidosis |
27135(9.8%) |
3332(10.1%) |
30467(9.8%) |
0.11 |
| Acute Myocardial Infraction |
4174(1.5%) |
982(3%) |
5156(1.7%) |
<0.01 |
| Cardiogenic shock |
920(0.3%) |
452(1.4%) |
1372(0.4%) |
<0.01 |
| Septic shock |
14222(5.1%) |
2331(7.1%) |
16553(5.3%) |
<0.01 |
| Hepatorenal syndrome |
15801(5.7%) |
1729(5.3%) |
17530(5.7%) |
0.07 |
| Hepatopulmonary syndrome |
452(0.2%) |
44(0.1%) |
496(0.2%) |
0.210 |
| Hyponatremia |
55730(20.1%) |
6581(20%) |
62311(20.1%) |
0.722 |
| Cardiac arrest |
2656(1%) |
561(1.7%) |
3217(1%) |
<0.01 |
|
|
|
|
<0.01 |
| Hospital Control and or funding |
|
|
|
|
| Government or Private |
25427(9.2%) |
2539(7.7%) |
27966(9%) |
<0.01 |
| Government, non-federal |
115121(41.5%) |
15483(47.1%) |
130604(42.1%) |
<0.01 |
| Private, not-for-profit |
32327(11.7%) |
3797(11.6%) |
36124(11.7%) |
<0.01 |
| Private, investor-owned |
4281(1.5%) |
508(1.5%) |
4789(1.5%) |
<0.01 |
| Private, either not-for-profit or investor-owned |
25427(9.2%) |
2539(7.7%) |
27966(9%) |
<0.01 |
| Hospital Location |
|
|
|
|
| Rural |
23296(8.4%) |
2823(8.6%) |
26119(8.4%) |
0.34 |
| Urban Non-teaching |
101223(36.5%) |
12801(39%) |
114024(36.8%) |
0.34 |
| Urban Teaching |
152582(55.1%) |
17234(52.4%) |
169816(54.8%) |
0.34 |
| Bed size of the hospital |
|
|
|
|
| small |
32833(11.8%) |
4062(12.4%) |
36895(11.9%) |
0.39 |
| medium |
68367(24.7%) |
8301(25.3%) |
76668(24.7%) |
0.39 |
| large |
175901(63.5%) |
20495(62.4%) |
196396(63.4%) |
0.39 |
| Primary payer |
|
|
|
|
| Medicare |
115370(41.7%) |
22830(69.6%) |
138200(44.7%) |
<0.01 |
| Medicaid |
63817(23.1%) |
3285(10%) |
67102(21.7%) |
<0.01 |
| Private insurance |
64509(23.3%) |
5029(15.3%) |
69538(22.5%) |
<0.01 |
| Self-pay |
19293(7%) |
825(2.5%) |
20118(6.5%) |
<0.01 |
| No charge |
2097(0.8%) |
124(0.4%) |
2221(0.7%) |
<0.01 |
| other |
11418(4.1%) |
725(2.2%) |
12143(3.9%) |
<0.01 |
| Region no. (%) |
|
|
|
|
| Northeast |
79265(28.6%) |
10017(30.5%) |
89282(28.8%) |
<0.01 |
| Midwest |
124166(44.8%) |
13657(41.6%) |
137823(44.5%) |
<0.01 |
| South |
45619(16.5%) |
5833(17.8%) |
51452(16.6%) |
<0.01 |
| West |
28051(10.1%) |
3351(10.2%) |
31402(10.1%) |
<0.01 |
| Median household income no. (%) |
|
|
|
|
| 0–25th percentile |
87671(32.7%) |
9096(28.3%) |
96767(32.2%) |
<0.01 |
| 26–50th percentile |
70412(26.3%) |
8211(25.6%) |
78623(26.2%) |
<0.01 |
| 51–75th percentile |
62278(23.2%) |
7859(24.5%) |
70137(23.4%) |
<0.01 |
| 76–100th percentile |
47783(17.8%) |
6931(21.6%) |
54714(18.2%) |
<0.01 |
†chronic liver disease
supplementary Table 1
† Decompensated Chronic Liver disease
Variable
DCLD† without Atrial Fibrillation (n=28,229)
DCLD† with Atrial Fibrillation (n=28,229)
P value
Age (mean [SD]) year
61.58(12.39)
68.46(11.81)
Female
10006(35.4%)
9900(35.1%)
0.349
Race
Caucasian
20912(74.1%)
20989(74.4%)
0.41
African American
2842(10.1%)
2748(9.7%)
0.41
Hispanics
2944(10.4%)
2972(10.5%)
0.41
Asian or Pacific Islander
671(2.4%)
660(2.3%)
0.41
Native American
139(0.5%)
167(0.6%)
0.41
AHRQ co morbidities
Anemia (chronic blood loss)
1302(4.6%)
1060(3.8%)
<0.01
Anemia (Deficiency anemia)
9594(34%)
9594(34%)
0.05
Collagen vascular diseases
653(2.3%)
557(2%)
0.05
Congestive heart failure
8502(30.1%)
8502(30.1%)
0.03
Chronic pulmonary disease
7805(27.6%)
7805(27.6%)
0.5
Coagulopathy
9014(31.9%)
9014(31.9%)
0.52
Diabetes, uncomplicated
8762(31%)
8762(31%)
0.89
Diabetes with chronic complications
2372(8.4%)
2372(8.4%)
0.78
Hypertension (combine uncomplicated and complicated)
15832(56.1%)
15832(56.1%)
0.01
Hypothyroidism
4822(17.1%)
4822(17.1%)
0.8
Lymphoma
265(0.9%)
318(1.1%)
0.03
Fluid and electrolyte disorders
13957(49.4%)
13957(49.4%)
0.53
Metastatic cancer
608(2.2%)
608(2.2%)
<0.01
Obesity
3481(12.3%)
3430(12.2%)
0.51
Peripheral vascular disorders
2546(9%)
2532(9%)
0.86
Renal failure
10110(35.8%)
10110(35.8%)
0.6
Solid tumor without metastasis
1244(4.4%)
1225(4.3%)
0.7
Valvular disease
3135(11.1%)
3497(12.4%)
<0.01
Associated diagnosis
Acute Myocardial Infraction
735(2.6%)
850(3%)
<0.01
Cardiogenic shock
364(1.3%)
399(1.4%)
0.2
Septic shock
2027(7.2%)
2050(7.3%)
0.70
Hepato renal syndrome
1775(6.3%)
1506(5.3%)
<0.01
Hepato Pulmonary syndrome
63(0.2%)
41(0.1%)
0.03
Acidosis
2980(10.6%)
2909(10.3%)
0.33
Hospital Location
Rural
2201(7.8%)
2264(8%)
0.03
Urban Non-teaching
11053(39.2%)
11305(40%)
0.03
Urban Teaching
14974(53%)
14660(51.9%)
0.03
Bedside of the hospital
Small
3428(12.1%)
3469(12.3%)
0.15
Medium
7012(24.8%)
7191(25.5%)
0.15
Large
17788(63%)
17569(62.2%)
0.15
Region
Northeast
7999(28.3%)
8369(29.6%)
<0.01
Midwest
12177(43.1%)
11433(40.5%)
<0.01
South
5457(19.3%)
5566(19.7%)
<0.01
West
2595(9.2%)
2861(10.1%)
<0.01
Median household income no. (%)
0–25th percentile
8249(29.2%)
8109(28.7%)
0.2
26–50th percentile
7279(25.8%)
7165(25.4%)
0.2
51–75th percentile
6724(23.8%)
6873(24.3%)
0.2
76–100th percentile
5976(21.2%)
6082(21.5%)
0.2
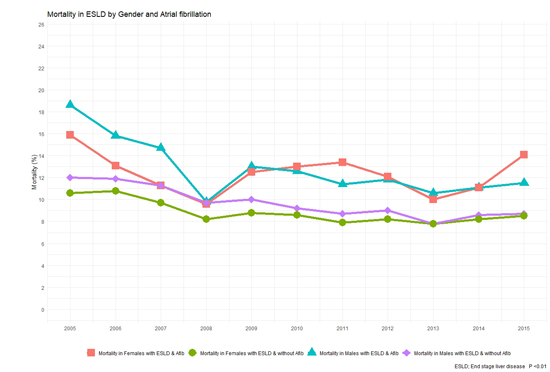
A total of 309,959 patients with ESLD were identified from the NIS dataset. Out of these 32,858 patients had AF (10.6%). Baseline characteristics of the study population are shown in [Table 1]. ESLD patients with AF were older (68.46 vs. 58.14 years, p < 0.01) and had higher burden of key co-morbidities such as diabetes (29.9% vs. 25.3%, p < 0.01), hypertension (53.8% vs. 40.1%, p < 0.01) and congestive heart failure (31.2% vs. 9.3%, p < 0.01). Overall, about 29,487 (9.5%) ESLD patients died at discharge (see [Table 2]). Mortality was 9.2% in ESLD without AF when compared to 12.3% in ESLD with AF (p < 0.01). In a propensity-matched cohort, this mortality difference continues to remain significant (12.2% vs. 10.8%, p < 0.01, supplemental []). A gradual downtrend trend in mortality was noted in ESLD patients with and with out AF over our study years (see [Figure 2]). This downward trend is same across both genders although male patients had higher mortality when compared to female patients over our study period (see [Figure 3]).
Table 2. Hospital encounter outcomes and resource utilization of the study cohorts
| Variables | ESLD† patients without atrial fibrillation (N=277,101) | ESLD† patients with atrial fibrillation (n=32, 858) | All ESLD† patients (n=309,959) | P value |
|---|
| Died at discharge | 25441(9.2%) | 4046(12.3%) | 29487(9.5%) | <0.01 |
| Discharge Disposition of surviving patients, No. (%) | | | | |
| Routine/self-care | 150811(60%) | 12001(41.7%) | 162812(58.1%) | <0.01 |
| Short-term hospital | 10822(4.3%) | 1260(4.4%) | 12082(4.3%) | <0.01 |
| Another type of facility | 46192(18.4%) | 8907(30.9%) | 55099(19.7%) | <0.01 |
| Home Health Care | 37756(15%) | 6212(21.6%) | 43968(15.7%) | <0.01 |
| Resource utilization, Mean (SD), No. (%) | | | | |
| Length of stay, mean (SD), days | 7.36(8.9) | 9(9.9) | 7.54(9.1) | <0.01 |
| Cost of hospitalization-mean (SD), $ | 63,403(111050) | 78,246(124777) | 64,972 (112673) | <0.01 |
| Procedures during stay | | | | |
| Left heart catheterization | 2571(0.9%) | 819(2.50%) | 3390(1.1%) | <0.01 |
| Undergoing Per Cutaneous Coronary intervention | 659(0.2%) | 150(0.5%) | 809(0.3%) | <0.01 |
| Vasopressin | 3097(1.1%) | 646(2%) | 3743(1.2%) | <0.01 |
| Hemodialysis | 18667(6.7%) | 4219(12.8%) | 22886(7.4%) | <0.01 |
| Ventilator | 26963(9.7%) | 3777(11.5%) | 30740(9.9%) | <0.01 |
| Gastrostomy | 2039(0.7%) | 406(1.2%) | 2445(0.8%) | <0.01 |
| Tracheostomy | 2533(0.9%) | 447(1.4%) | 2980(1%) | <0.01 |
† End stage liver disease
Supplementary Table 2. Hospital encounter outcomes and resource utilization of the study cohort in match data
| Hospital Outcomes, No. (%) | ESLD without atrial fibrillation (28228) | ESLD with atrial fibrillation (28229) | P value |
|---|
| Died at discharge | 3051(10.8%) | 3457(12.2%) | P<0.01 |
| Resource utilization, Mean (SD) | | | |
| Length of stay, mean (SD), days | 8.11(9.6) | 9.03(9.63) | <0.01 |
| Mean cost | 73408(128412) | 80792(128241) | <0.01 |
| PEG | 248(0.9%) | 357(1.3%) | <0.01 |
| Tracheostomy | 327(1.2%) | 389(1.4%) | 0.02 |
†End Stage Liver Disease
Figure 2. Mortality in end stage liver disease with and with out atrial fibrillation over study years
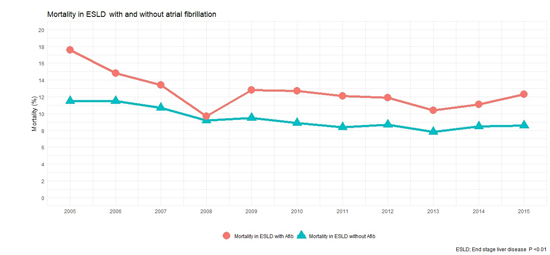
Figure 3. Mortality in end stage liver disease by gender and atrial fibrillation over study years
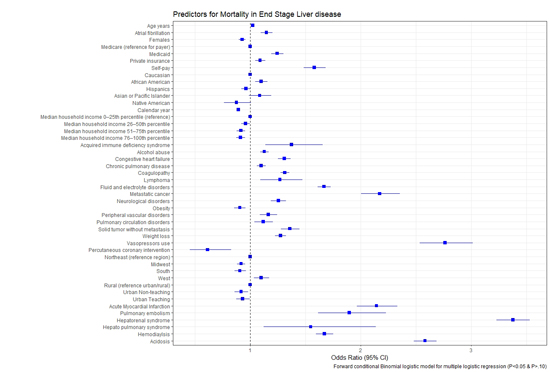
ESLD patients with AF have longer length of stay (9 vs. 7.36 days, p < 0.01) and increase costs of hospitalization (78,246 $ vs. 63,403 $, p < 0.01) when compared to ESLD patients with out AF. Please see [Figure 4] for length of stay and costs of hospitalization trends over our study years. Predictors of mortality in ESLD are shown in [Figure 5]. Advanced age, AF and African American race were independently associated with increased mortality. Urban and large hospitals were associated with lower mortality. Patients with metabolic acidosis, coagulopathy, pulmonary circulation disorders, congestive heart failure and cancers were also associated with increased mortality in our study cohort.
Figure 4. Mean cost of hospitalization and length of stay over our study period
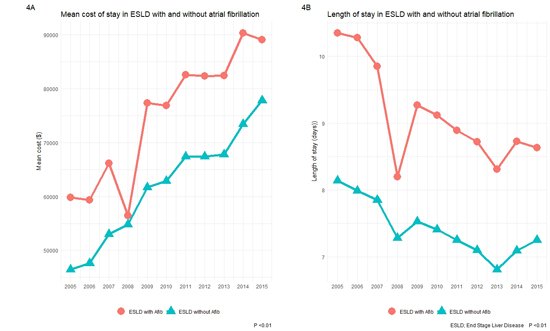
Figure 5. Predictors of mortality in end stage liver disease patients
The main findings of our current investigation are: (1) ESLD patients with concomitant AF have increased mortality when compared to ESLD patients with out concomitant AF (12.30% vs. 9.20%, p < 0.01) and this difference persisted despite balancing co-variates in a propensity matched model (12.2% vs. 10.8%, p < 0.01). (2) The presence of AF is an independent predictor of mortality in ESLD patients and about 10.6% patients in our cohort have AF. (3) ESLD and AF patients have increased cost of hospitalization as well as length of stay when compared to ESLD patients with out AF.
ESLD is a rising global health burden and represents a final sequel in natural history of liver cirrhosis [1],[2]. Frequent hospitalizations are common in ESLD patients due to concomitant complications of hepatic encephalopathy, SBP and gastrointestinal bleeding [3]. ESLD patients are more prone to developing AF even in absence of structural heart disease. This increased propensity of developing AF is proposed to be due to autonomic dysfunction and increased levels of circulating neuropeptides such as VIP and galactin-3 that exercise their effect either through modulating autonomic system or inducing fibrosis with in the heart muscle [4],[5],[6],[7]. The prevalence of AF in our cohort is about 10.6%, which is consistent with earlier studies. The study by Huang et al. [8] on 1727 consecutive ESLD patients awaiting liver transplantation showed AF prevalence to be about 11.2%. They also found that liver disease is an independent predictor of new onset AF and increased MELD scores are subsequently associated with worsening risk of new AF development. Similarly, another study by Lee et al. [11] has found 46% relative risk of developing AF in patients with liver cirrhosis. In comparison to our study, they did not find AF to be significantly associated with all-cause mortality. It is pertinent to mention here that Lee et al. primarily enrolled patients with various stages of cirrhosis while our study exclusively focused on ESLD cohort which is comparatively more sicker and morbid and that may explain difference in mortality between both studies. In another study on ESLD patients undergoing liver transplantation [12], the occurrence of peri-procedural AF was associated with worsened mortality (HR 5.097, 95% CI 2.189-11.86). In our national cohort of ESLD patients, we have demonstrated that AF is associated with worse in-patient survival and that difference persists despite accounting for confounding variables. We also demonstrated that AF is an independent predictor of mortality in ESLD patients.
The strong association of worse outcomes of ESLD patients with AF poses unique management challenges. Stroke is a leading cause of mortality and disability in AF patients and anti-coagulation is often recommended to mitigate those risks [13],[14]. The utilization of anti-coagulation can be especially challenging in ESLD patients due to increased bleeding risk associated with platelet dysfunction and esophageal varices [15]. Additionally, there are studies showing increased propensity of hemorrhagic stroke in ESLD patients and that risk in some cases exceeds those of ischemic stroke [16],[17]. Our dataset, unfortunately, is not designed to ascertain causes of mortality but whether embolic or bleeding events contributed to poor outcomes needs further studies. Additionally, the association of worse mortality in ESLD patients with AF also calls into question measures to screen for AF in this patient population. Timely detection of AF and subsequent implementation of relevant therapeutic measures could result in improved outcomes in ESLD patients.
NIS is an administrative claim-based database that uses ICD-9-CM codes for diagnosis that may be subjected to error. The hard clinical points such as liver cirrhosis and mortality are, however, less prone to error. There are no well-defined ICD-9-CM codes for ESLD and we have used Goldberg’s third algorithm for stratifying these patients as mentioned in methods section. This method yields a positive predictive value of about 89.3% for ESLD but it is still plausible that some patients with ESLD may not have been captured using this methodology. NIS collects data on in-patient discharges and each admission is registered as an independent event. It is possible that same patient may have more than one subsequent admission over time. NIS samples are not designed to follow patients longitudinally so long-term outcomes could not be assessed from the present dataset. Additionally, data on AF management is lacking from NIS which have important implications on conclusions drawn from the study.
Our study shows AF to be associated with worse outcomes in ESLD patients. It is therefore imperative that treating physicians should have a strong clinical suspicion for AF in this specific patient cohort as timely AF detection could result in improved outcomes.
- Bosetti C, Levi F, Lucchini F, Zatonski WA, Negri E, La Vecchia C. Worldwide mortality from cirrhosis: an update to 2002. J Hepatol. 2007;46:827‐839.
- Zhang Y, Ren JS, Shi JF, Li N, Wang YT, Qu C, Zhang Y7, Dai M. International trends in primary liver cancer incidence from 1973 to 2007. BMC Cancer. 2015;15:94.
- Crager S. Critically Ill Patients with End-Stage Liver Disease. Emerg Med Clin North Am. 2019;37:511-527.
- Dümcke CW, Møller S. Autonomic dysfunction in cirrhosis and portal hypertension. Scand J Clin Lab Invest. 2008;68:437-47.
- Rangari M, Sinha S, Kapoor D, Mohan JC, Sarin SK. Prevalence of autonomic dysfunction in cirrhotic and noncirrhotic portal hypertension. Am J Gastroenterol. 2002;97:707-13.
- Voigt MD, Trey G, Levitt NS, Raine R, Lombard CJ, Robson SC, Gordon G, Kirsch RE. Autonomic neuropathy in extra-hepatic portal vein thrombosis: evidence for impaired autonomic reflex arc. J Hepatol. 1997;26:634-41.
- Patel P, Dokainish H, Tsai P, Lakkis N. Update on the association of inflammation and atrial fibrillation. J Cardiovasc Electrophysiol. 2010;21:1064-70.
- Huang WA, Dunipace EA, Sorg JM, Vaseghi M. Liver Disease as a Predictor of New-Onset Atrial Fibrillation. J Am Heart Assoc. 2018;7:e008703
- Agency for Healthcare Research and Quality. Overview of the national
(nationwide) inpatient sample (NIS). Rockville: AHRQ; https://www.hcup-us.ahrq.gov/nisoverview.jsp#about. Published 2019. Accessed on October 19, 2019.
- Goldberg D, Lewis J, Halpern S, Weiner M, Lo Re V. Validation of a coding algorithm to identify patients with end-stage liver disease in an administrative database. Pharmacoepidemiol Drug Saf. 2012;21:765–769.
- Lee H, Choi EK, Rhee TM, Lee SR, Lim WH, Kang SH, Han KD, Cha MJ, Oh S. Cirrhosis is a risk factor for atrial fibrillation: A nationwide, population-based study. Liver Int. 2017;37:1660-1667.
- Moon YJ, Kwon HM, Park YS, Kim SH, Hwang GS. Brief Episodes of Newly Developed Intraoperative Atrial Fibrillation Predicts Worse Outcomes in Adult Liver Transplantation. Transplant Proc. 2018;50:1142-1146.
- Candelise L, Pinardi G, Morabito A. Mortality in Acute Stroke with Atrial Fibrillation. Stroke. 1991;22:169-174.
- Amerena J, Ridley D. An Update on Anticoagulation in Atrial Fibrillation. Heart Lung Circ. 2017;26:911-917.
- Qamar A, Vaduganathan M, Greenberger NJ, Giugliano RP. Oral Anticoagulation in Patients With Liver Disease. J Am Coll Cardiol. 2018;71:2162-2175.
- Parikh NS, Navi BB, Schneider Y, Jesudian A, Kamel H. Association Between Cirrhosis and Stroke in a Nationally Representative Cohort. JAMA Neurol. 2017;74:927-932.
- Parikh NS, Navi BB, Kumar S, Kamel H. Association between Liver Disease and Intracranial Hemorrhage. J Stroke Cerebrovasc Dis. 2016;25:543-8.


