Serial Magnetic Resonance Imaging after Electrical Cardioversion of Recent Onset Atrial Fibrillation in Anticoagulant-Naïve Patients – A Prospective Study Exploring Clinically Silent Cerebral Lesions
Panagiotis Arvanitis1*, Anna-Karin Johansson2*, Mats Frick2, Helena Malmborg1, Spyridon Gerovasileiou3, Elna-Marie Larsson4, Carina Blomström-Lundqvist1
1Department of Medical Science and Cardiology, Uppsala University, Uppsala, Sweden.2Stockholm South General Hospital, Department of Cardiology, Stockholm, Sweden.3Department of Medical Sciences, Uppsala University, Clinical Physiology and Cardiology, Uppsala University Hospital, Uppsala, Sweden.4Department of Surgical Science, Radiology, Uppsala University, Uppsala, Sweden.*Joint primary authors.
Patients with atrial fibrillation (AF) have a high incidence of cognitive impairment, which may be related to clinically silent microembolism causing cerebral infarctions.
To explore the occurrence and timing of silent brain lesions following electrical cardioversion (CV) of recent onset AF in anticoagulant-naïve patients and to study related effects on cognitive function and biomarkers of cerebral damage, S100b.
Patients with AF duration > 48 hours were prospectively included. Brain magnetic resonance imaging (MRI) and S100b, were obtained prior, after and 7-10 days following CV. Trail making tests (TMT-A and TMT-B) and their difference, ΔΤΜΤ, were assessed prior to CV, 7-10 days and 30 days after CV.
Forty-three patients (84% males) with median CHA2DS2-VASc score 1 (interquartile range 0-1) were included. Sequential MRI, including diffusion weighted scans, showed no new brain lesions after CV. Chronic white matter hyperintensities were present at baseline in 21/43 (49%) patients. The S100b (µg/l) levels increased significantly from baseline, (mean ±SD) 0.0472±0.0182 to 0.0551±0.0185 after CV, p=0.001 and then decreased 7-10 days after CV to 0.0450±0.0186, p <.;0.001. Consecutive TMT scores improved successively after CV, being statistically and clinically significant for TMT-B (p<0.01) and ΔΤΜΤ (p=0.005) between 7-10 days and 30 days after CV (Reliable Change Index >1.96).
New brain lesions could not be detected on MRI after CV, but the high incidence of white matter hyperintensities and the transient increase in S100b may indicate transient or minor brain damage undetectable by MRI thus heightening the need to reevaluate thromboembolic risk prior to CV even in low risk patients.
Key Words : Silent brain lesions, Atrial fibrillation, Cognitive function, Cardioversion.
Panagiotis Arvanitis, MD,
Uppsala University Hospital, Arrhythmia Laboratory,
Sjukhusvägen 9, Ing 35,
75309 Uppsala, Sweden
Atrial fibrillation (AF), the most common cardiac arrhythmia, is an independent risk factor for thromboembolism (TE) such as ischemic stroke1. Cardioversion (CV) is indicated for symptom relief as part of a rhythm-control strategy in almost all types of AF2. Traditionally, if the current AF episode duration is longer than 48 hours, therapeutic oral anticoagulants (OAC) is recommended for three weeks prior to elective CV to reduce the thromboembolic risk2. The recommended safety time-window of 48 hours in OAC naïve patients, based on arbitrarily defined safety margins, may have limited clinical justification in the light of emerging new evidence suggesting better safety with even shorter time intervals and initiation of OAC prior to CV3-5.
A higher incidence of cognitive impairment and dementia were observed in patients with AF even in the absence of clinically overt TE events6,7, and are considered to be the consequence of clinically silent cerebral infarctions caused by microembolism7-9. An unexpectedly high (4.7%) incidence of silent TE, detected by brain magnetic resonance imaging (MRI), was observed in patients treated with OAC prior to elective CV10.
The purpose of this study was to explore the occurrence and timing of new silent TE events after CV of OAC-naïve patients with recent onset AF and a low thromboembolic risk using MRI and furthermore to study related effect on cognitive function and biomarker of cerebral damage.
Patients with symptom-guided definite onset of AF within 48 hours, naïve to OAC, and eligible for rhythm control treatment with electrical CV were included. Patients were recruited from the emergency departments of Uppsala University hospital (Akademiska Sjukhuset) and Stockholm South General Hospital (Södersjukhuset). (Clinicaltrials.gov identifier: NCT02955004)
Exclusion criteria were known moderate to severe valvular disease, previous or acute cerebrovascular event or thromboembolism, heart failure, moderate or severe left ventricular systolic dysfunction, CV for AF in the preceding 3 months, known coagulation defects and contraindication for MRI. Patients who spontaneously converted to sinus rhythm prior to brain imaging were excluded from the study.
Electrical CV was performed in a fasting state with a QRS-gated, biphasic waveform shock and repeated, if required, three times with energy levels of 150-200 J, 300 J and 360 J respectively. Neither heparin or low molecular weight heparin were used periprocedurally. Propofol was used for sedation.
In order to cover the time intervals associated with the highest thromboembolic event rates after a CV11, investigations were scheduled within 2 hours before CV (pre-CV interval), 1-3 hours after (post-CV interval) and at 7-10 days after CV (Visit-1) representing the recovery period of the left atrial contractile function12. The last follow-up was at 30 days after CV (Visit-2). [Figure 1]
Figure 1. Study flowchart
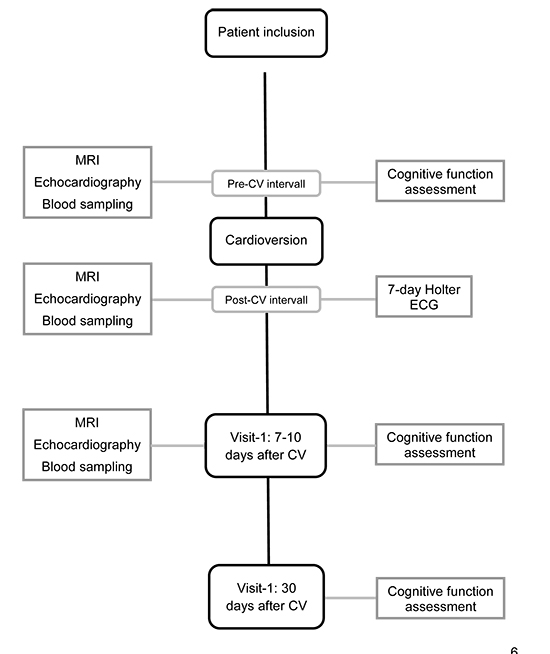
MRI: Magnetic Resonance Imaging; CV: Cardioversion; ECG: Electrocardiography
All patients underwent a standardized neurological examination according to the National Institute of Health Stroke Scale (NIHSS)13 prior to CV. Transthoracic echocardiography, brain MRI and blood sampling (biomarkers of cerebral damage, inflammation, and coagulation activity), were all performed prior to CV, after CV and at 7-10 days after CV. Protein S100b, a small dimeric 21 kDa calcium-binding protein predominantly expressed by the nervous system was analyzed with Roche® Cobas Elecsys S100b reagent kit. The normal reference value for S100b was ≤ 0.10 µg/l. A 7-day Holter monitoring was performed at discharge after CV to detect early AF recurrence. Cognitive function was assessed using the Mini Mental State Examination (MMSE), and Trail Making Test A and B (TMT-A, TMT-B), prior to CV and at 7-10 days and 30 days after CV 14,15. The normal reference scores for MMSE is between 24 and 30 points, with higher scores indicating better cognitive function. The TMT A and B measure the time (in seconds) needed to complete a specific task, consequently shorter times or lower scores indicate better cognitive function. The difference between TMT-A and TMT-B times, considered to be a measure of cognitive flexibility relatively independent of manual dexterity, was also calculated16,17. The TMT scores were evaluated by using previously published normative data15. The results of sequential echocardiographic examinations and inflammatory and coagulation activity biomarkers will be presented in another study.
The primary objective was to confirm the presence of new clinically silent cerebral lesions with sequential brain MRI after CV of patients with recent onset AF. Furthermore, the effect of restoration of sinus rhythm on cognitive function and circulating levels of the biomarker for cerebral damage, S100b was also explored.
Magnetic Resonance Imaging
The brain MRI included three examinations for each patient, either a 1.5 Tesla or a 3 T system (both Achieva, Philips, Best, the Netherlands) in Uppsala, and a 1.5 Tesla system (Aera, Siemens Healthcare, Erlangen, Germany) in Stockholm. The same scanner was used for all three sequential MRI examinations in each patient. All scans included transverse diffusion weighted imaging (DWI) using echo planar imaging (EPI) technique with repetition time (TR) and echo time (TE) optimized for each of the three scanners used, with a slice thickness of 4-5 mm, diffusion-weighting factor b = 1000 s/mm2 and diffusion encoding along 3 directions. Apparent diffusion coefficient (ADC) maps were automatically calculated in the scanners. A transverse T2-weighted fluid attenuated inversion recovery (FLAIR) sequence was also acquired in all examinations with the following parameters: TR/TE/Inversion time = 9000-11000 ms/86-140 ms/2500-2800 ms, slice thickness 4-5 mm.
All MRI scans were visually evaluated by one experienced neuroradiologist with regard to presence, number and size of acute ischemic lesions on DWI and ADC maps (as defined by decreased diffusion seen as high signal intensity on DWI and low signal on ADC maps, where also quantitative measurements were performed if needed). On T2FLAIR images, the presence of chronic white matter lesions, old infarcts and incidental findings was evaluated. Chronic deep white matter lesions, also named white matter hyperintensities (WMH), were visually scored using the Fazekas scale ranging from 0 to 3, where 0 equals normal, 1 is assigned to punctate lesions and 3 is assigned to the most extreme cases where extensive and confluent lesions are present18.
The normality of distribution of continuous variables was tested by one-sample Kolmogorov-Smirnov test. Continuous variables with normal distribution are presented as mean ± standard deviation (SD), and categorical as n and percentage (%). Continuous normally distributed variables were compared with the use of paired or independent samples Student's t test. The frequencies and associations of categorical variables were assessed using Pearson χ2-test. The presence of associations between ordinal variables was analyzed by ordinal regression. Repeated measures analysis of variance (ANOVA) with of Greenhouse-Geisser or Huynh-Feldt correction for violation of Mauchly's test of sphericity was used to analyze serial results. The presence of practice effects on cognitive function tests was assessed using the Reliable Change Index (RCI); values bellow 1.96 may denote effect of repetition and values above 1.96 signalize change of clinical significance.19 A value of P < 0.05 was considered significant. The data were analyzed using IBM Statistical Package for the Social Sciences, version 25 for Windows, (IBM Corp. Released 2017. IBM SPSS Statistics for Windows, Version 25.0. Armonk, NY).
Determination of sample size was based on the varying frequencies (4-38 %) of new silent cerebral lesions on MRI after various cardiac interventions 20-23. Based on these observations we argued that a 20 % increase in incidence of new asymptomatic cerebral ischemic lesions in patients undergoing electrical CV would be clinically significantly meaningful. For a 20% increase in incidence of silent cerebral lesions following CV, the required number of patients to reject the null-hypothesis with 90% power and at the 0.05 significance level (two-sided) was estimated to 35, as each patient will serve as own control, and 5 more patients were added to ensure complete number of included patients.
The study protocol was approved by the Regional Ethical Review Board and complied with the Declaration of Helsinki. Written informed consent was obtained from each study participant.
From March 1, 2015 to October 31, 2017, forty-six patients fulfilled inclusion criteria of the study. Four patients were excluded; three due to spontaneous conversion to sinus rhythm prior to MRI and one due to withdrawal of consent prior to CV, leaving 43 patients in the study. [Table 1] shows baseline characteristics of the study population. Paroxysmal AF was present in 17 (39.5%) patients, persistent AF in 9 (20%) patients, leaving 17 (39.5%) patients with first onset AF. The CHA2DS2-VASc score24, was 0 in 21 (48.8%) patients, 1 in 19 (44.2%) patients, 2 in 2 (4.7%) patients and 3 in one (2.3%) patient. Eight of the 43 (18.6%) patients received treatment with novel oral anticoagulants after CV; seven male patients prior to discharge ( CHA2DS2-VASc score≥2 or age over 65 year-old) and one patient on the 6th day due to peripheral emboli.
Table 1. Basic characteristics of study population
| Variables |
Patients n = 43 |
| Gender, females, n (%) |
7 (16.3) |
| Age, yrs. |
55±9.6 |
| BMI, kg/m2 |
26±3.4 |
| Hypertension, n (%) |
9 (20.9) |
| Diabetes Mellitus, n (%) |
2 (4.7) |
| Vascular disease, n (%) |
1 (2.3) |
| AF duration from symptom onset to diagnosis (hours) |
13.3±11.7 |
| Previous history of paroxysmal AF, n (%) |
19 (39.5) |
| Previous history of persistent AF, n (%) |
9 (20.9) |
| CHA2DS2-VASc = 0, n (%) |
21 (48.8) |
| CHA2DS2-VASc = 1, n (%) |
19 (44.2) |
| CHA2DS2-VASc = 2, n (%) |
2 (4.7) |
| CHA2DS2-VASc = 3, n (%) |
1 (2.3) |
| Plasma Creatinine, µmol/L |
82.8±13.5 |
| Systolic BP (mmHg) |
125±13 |
| Diastolic BP (mmHg) |
81±9 |
| ACE/ARB medication, n (%) |
8(18.6) |
| Antiplatelet therapy, n (%) |
0(0) |
| Beta receptor blockers, n (%) |
9(20.9) |
| Heart rate at presentation (bpm) |
110±31 |
| Left atrial volume index ml/m2 |
31±8.9 |
| Left ventricular ejection fraction, % |
55.9±8.4 |
| Significant valvular disease, n (%) |
0(0) |
Figures are mean ± standard deviation unless otherwise stated; ACE: Angiotensin Converting Enzyme; AF: Atrial fibrillation; ARB: Aldosterone receptor blocker; BMI: Body Mass Index; BP: Blood Pressure; CV: Cardioversion; Kg: kilogram; m: meter; ml: milliliter; yrs.: years
Electrical CV was successful after a first attempt in 39 patients; after 2-3 attempts in two patients while two patients converted spontaneously to sinus rhythm after the first MRI examination.
The 7-day Holter monitoring after CV detected AF recurrence in 4 (9.3%) patients; of whom three had paroxysmal AF with 33-183 seconds episodes and one patient had persistent AF later scheduled for repeat elective CV.
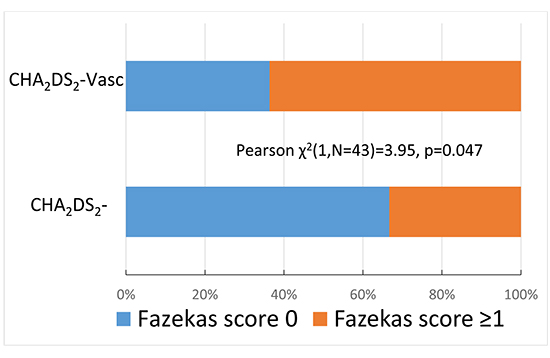
MRI of the brain prior to CV showed no signs of recent acute ischemic lesions corresponding to micro-emboli or larger lesions and there were no new lesions detected in any of the sequential MRI. White matter T2 hyperintense (WMH) lesions, were identified at baseline in 21/43 (49%) of the patients. Fazekas score 0 was present in 22/43 (51%), Fazekas score 1 was present in 18/43 (42%) and Fazekas score 2 in 3 (7%) of the patients. Ordinal regression analysis revealed no association between the Fazekas score and the CHA2DS2-VASc risk score. By partitioning the study population into four major groups according to the extend of WMH (Fazekas score 0 or ≥ 1) and the presence or absence of TE risk factors (CHA2DS2-VASc score 0 or ≥ 1), the TE risk as defined by CHA2DS2-VASc score ≥ 1, was associated with a higher incidence of WMH, Pearson χ2(1,N=43)=3.95, p=0.047, [Figure 2].
Figure 2. Association between the CHA2DS2-Vasc score and the Fazekas score
Old lacunar infarcts were present in 2 (5%) patients; of whom both had a CHA2DS2-VASc score above 1. Incidental findings were mastoiditis, suspected pituitary adenoma, sinusitis, arachnoid cyst and a pineal cyst in one patient each.
Clinical thromboembolic events
One patient with CHA2DS2-VASc score 0 experienced an embolus in the finger on the 6th day after CV and but was subsequently found to be a heterozygote for Factor V (Leiden mutation), nucleotide 1691. Baseline MRI of the brain revealed no chronic white matter lesions. The patient received life-long treatment with OAC.
Biomarker for brain damage, S100b
All baseline and sequential measurement of S100b were within the normal reference interval. The mean S100b prior CV increased from 0.0472±0.0182 µg/l to 0.0551±0.0185 µg/l after CV, p=0.001 and then decreased to 0.0450±0.0186 µg/l, p<0.001 at 7-10 days after CV, both changes were statistically significant. Repeated measures ANOVA revealed a statistically significant overall changes of mean S100b, F (2,68)=12.22, p<0.001. Subgroup analysis according to the presence of at least one TE risk factor as defined by CHA2DS2-VASc score showed that statistical significance of repeated measures ANOVA was maintained; for patients with no risk factors F (2,30)=12.59, p<0.001 and for patients with CHA2DS2-VASc score ≥1 F(2,36)=4.43, p<0.019. There was no statistically significant difference in mean S100b values neither between patients with at least one CHA2DS2-VASc score as compared with those without risk factors [Figure 3], nor in patients treated with OAK after CV.
Figure 3. The changes of the biomarker of cerebral damage, S100b, in relation to cardioversion
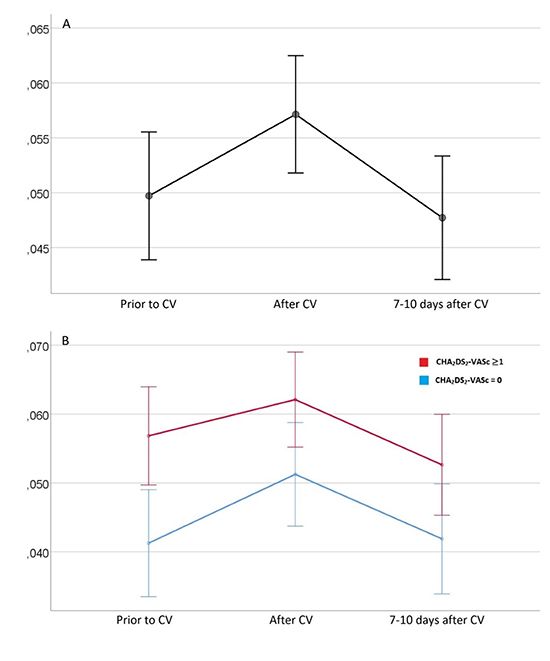
Repeated measure ANOVA, profile plots of estimated marginal means of S100b. Panel A shows overall changes, F(2,68)=12.22, p<0.001; Panel B shows subgroups: blue line refers to patients with CHA2DS2-VASc score 0, F(2,30)=12.59, p<0.001; red line refers to patients with CHA2DS2-VASc score ≥1, F(2,36)=4.43, p<0.019; CV: Cardioversion; Small circles represent means; Line intervals represent mean ± 2 standard errors.
Mini-mental state examination scores were within the upper limit of the normal range, between 24 and 30 points, at all measured time intervals in all but one patient in whom the baseline test showed lower scores. The mean MMSE scores improved (increased) sequentially [Table 2]. Repeated measures ANOVA revealed a statistically significant overall improvement of MMSE scores, F(2,84)=3.62, p=0.031, although MMSE paired t-tests showed no statistically significant difference.
All TMT-A and TMT-B scores fell within the normal age-stratified reference range according to previously published normative data15. The mean TMT-A and TMT-B times improved (decreased) with time and the same was observed for the calculated ΔTMT [Table 2]. Repeated measures ANOVA revealed a statistically significant overall improvement of TMT tests; TMT-A with Huynh-Feldt correction F(1.5,62.9)=4.23, p=0.029, TMT-B with Greenhouse-Geisser correction F(1.78,74.78)=8.02, p=0.01 and ΔTMT F(2.84,84)=6.48, p=0.02. Paired t-tests comparing consecutive TMT mean values showed statistically significant difference only between 7-10 day and 30 days for TMT-B, p=0.01 and ΔTMT, p=0.005. Adjusting for possible practice effects for the cognitive function tests confirmed that the improvement of TMT-B and the Δ-TMT from 7 days to 30 days, was not attributed to test repetition as indicated by mean RCI 2.67 and 3.0, respectively ([Table 2], [Figure 4]). The association of TMT times to the type of AF showed that patients with persistent AF had statistically significant prolonged TMT-B prior to CV and TMT-A and TMT-B at 30 days post-CV [Table 3]. Treatment with OAK was not associated with statistically significant differences in cognitive function tests results after CV
Table 2. Cognitive function tests results at the different time intervals before and after cardioversion
|
Prior to CV |
7-10 days after CV |
Prior vs 7-10 days after CV |
30 days after CV |
7-10 days vs 30 days after CV |
|
|
|
P value |
RCI |
|
P value |
RCI |
| MMSE |
29.3±1.2 |
29.4±1.0 |
0.35 |
<1.96 |
29.6±0.8 |
0.07 |
<1.96 |
| TMT-A (sec) |
23.3±8.4 |
22.0±10.1 |
0.07 |
<1.96 |
20.4±5.4 |
0.2 |
<1.96 |
| TMT-B (sec) |
52.8±25.2 |
50.3±30.3 |
0.43 |
<1.96 |
41.7±16.8 |
0.01 |
2.67 |
| Δ-TMT (sec) |
29.5±20.7 |
28.3±22.3 |
0.68 |
<1.96 |
21.3±14.7 |
0.005 |
3.0 |
CV: Cardioversion; MMSE: Mini Mental State Examination; TMT-A: Trail making test A; TMT-B: Trail Making Test B; Δ-TMT: Difference between Trail Making Test B and A; RCI: Reliable Change Index, values above 1.96 denote changes of clinical significance not attributed to practice effects
Figure 4. The cognitive function test results at the different time intervals before and after cardioversion
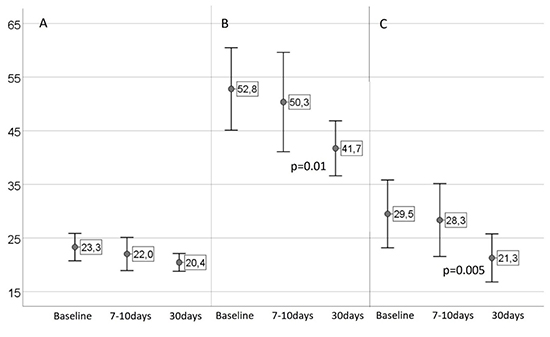
Repeated measure ANOVA, profile plots of estimated marginal means for Trail Making Tests. Panel A shows Trail Making test A results, F(1.5,62.9)=4.23, p=0.029; Panel B shows Trail Making test B results, F(1.78,74.78)=8.02, p=0.01; Panel C shows the difference between Trail Making test B and A, F(2.84,84)=6.48, p=0.02; Solid circles denote mean value and line intervals refer to mean ± 2 standard errors; Baseline: prior to cardioversion; 7-10days: 7-10 days after cardioversion; 30days: 30 days after cardioversion
Table 3. Association between type of atrial fibrillation and cognitive function test
|
|
Previous history of persistent AF |
One-way ANOVA |
|
|
No (n=34) |
Yes (n=9) |
F(1,41) = |
p value |
| Prior to CV |
| TMT-A (sec) |
22.1±7.9 |
27.8±8.8 |
3.44 |
0.071 |
| TMT-B (sec) |
48.7±22.6 |
68.0±29.9 |
4.48 |
0.04 |
| ΔΤΜΤ (sec) |
26.0±18.5 |
40.2±26.1 |
3.22 |
0.08 |
| 7-10 days after CV |
| TMT-A (sec) |
20.9±10.1 |
26.0±9.9 |
1.79 |
0.188 |
| TMT-B (sec) |
46.7±28.2 |
64.1±35.8 |
2.41 |
0.128 |
| ΔΤΜΤ (sec) |
25.7±20.4 |
38.1±27.4 |
2.25 |
0.141 |
| 30 days after CV |
| TMT-A (sec) |
19.3±4.2 |
24.8±7.3 |
8.56 |
0.006 |
| TMT-B (sec) |
38.7±12.3 |
52.9±26.1 |
5.54 |
0.023 |
| ΔΤΜΤ (sec) |
19.5±11.6 |
28.1±22.5 |
2.55 |
0.118 |
AF: Atrial Fibrillation; ANOVA: Analysis of Variance; CV: Cardioversion; TMT-A: Trail making test A; TMT-B: Trail Making Test B; Δ-TMT: Difference between Trail Making Test B and A
Magnetic resonance imaging findings
To our knowledge, this is the first prospective study investigating the incidence and timing of clinically silent cerebral lesions with sequential brain MRI in OAC-naïve patients with recent onset AF cardioverted within < 48 hours after AF onset. No signs of acute silent cerebral lesions were detected after CV, hence our primary hypothesis was not substantiated in any of the three MRI, covering the three time intervals with the highest risk for TE post CV: from AF onset to CV, immediately after CV, and 7-10 days after CV during recovery of the left atrial contractile function.
Diffusion weighted imaging is a highly sensitive MRI method able to detect silent cerebral embolism20,25 and silent lesions as early as 30 minutes after ischemia onset26. In a series of 62 patients with persistent AF, CHA2DS2-Vasc score 1.8±1.4 and at least 4 weeks effective OAC prior to elective CV, new silent brain lesions were neither observed at baseline nor at the 24-hours post-CV brain MRI27. In a similar series of 50 persistent AF patients with OAC and CHA2DS2-Vasc score 2.7±0.7, MRI at baseline and 14-days after elective CV showed no new cerebrallesions28. In another study, silent cerebral embolism were detected four weeks after CV in 4.7% 127 persistent AF patients with OAC for at least 4 weeks prior and 4 weeks after trans-esophageal echocardiography guided CV10. The relation between the high rate of silent TE with CV or the higher risk profile of the cohort per se, was unclear. Patients in both of these trials had higher CHA2DS2-Vasc scores as compared to the patients in the present study. The initiation of OAC after CV in 8/43 (18.6%) patients in the present study, may have contributed to a lower incidence of silent TE events.
In a large retrospective study of 22.874 AF patients, there were no TE events after CV in patients with CHA2DS2-Vasc score < 2 regardless of OAC treatment29. The risk for thromboembolic complications was, however, higher in patients without versus those with OAC at 30 days following electrical CV, odds ratio 2.54 (95% CI 1.70–3.79), after adjustment for CHA2DS2-Vasc score factors29. In the retrospective FinCV study, including 2,481 AF patients without OAC, the incidence of clinically evident TE events after CV was only 0.7%, within 30 days4. The risk for TE events, however, increased significantly from 0.4% in patients with CHA2DS2-Vasc score < 2 to 2.3% in those with scores ≥5, none of whom were on OAC4. Moreover, if the delay from AF onset to CV exceeded 12 hours the risk for TE events increased from 0.4% to 0.9% respectively, emphasizing the importance of early treatment 4,5.
Given the low TE risk in the present cohort, the incidence of WMH as quantified by Fazekas scale, was unexpectedly high (49%) with significant association with CHA2DS2-Vasc score. Although WMH are often considered to be a sequelae of infection or inflammation in subjects younger than 50-60 years, there is a growing amount of evidence of a clear association between AF and WMH30. In one study WMH were observed in 56.4% of persistent AF patients prior to elective CV27. In another study of 74 paroxysmal AF patients, WMH were present in 67.6% at baseline MRI prior to pulmonary vein isolation31. The CHA2DS2-Vasc score was an independent predictor for the presence of WMH and the Fazekas score was positively correlated with the CHA2DS2-Vasc scores 32, thus supporting our findings of an association between of TE risk and the degree of WMH.
Biomarker for brain damage
The finding of a significant increase in circulating levels of S100b after CV in the present study should be interpreted with caution. The use of S100b was, in several studies, associated with good reproducibility for predicting the presence, timing and extend of brain damage33-36. Moreover, elevated levels of S100b were detected 48 to 72 hours before any clinical, laboratory or ultrasound signs of cerebral bleeding or hypoxic ischemic encephalopathy occurred in preterm infants or full-term infants33,36,37. Another report demonstrated elevated S100b in the search for acute asymptomatic brain injury during catheter ablation of AF suggesting increased sensitivity and a complementary tool to brain MRI38. A recent AF ablation study suggested that S100B is released from cardiac glial cells and is a hallmark of acute intra-cardiac neural damage during AF ablation39. Whether the same mechanism could explain the rise in S100b after CV is, however, unclear. There are thus several possible explanations for the rise in S100B apart from central nervous system sources.
First, extra-cerebral sources of S100b originating from adipose tissue, myocardium, intrinsic cardiac nervous system and skeletal muscle may have compromised the diagnostic value of S100b as a biomarker of cerebral injury39,40, since the effect of CV on extra-cerebral tissue and S100b release is unknown. Secondly, propofol used for sedation is reported to play a protective role, increasing astrocyte viability and hence attenuating the release of S100b41,42. Thirdly, stressful physical and mental activity, including psychiatric disorders, may influence the levels of S100b43,44. Finally, increases in S100B levels in AF patients have previously been linked to renal insufficiency, but none of our patients had impaired kidney function45. Consequently, to what extent the transient increase of S100b after CV and restoration of sinus rhythm may indicate minor cerebral damage not detected by MRI is unclear and its clinical implementation remains to be settled.
All cognitive function tests improved at the three sequential time intervals. Changes in MMSE score and its clinical implementation must be taken with caution, since it is a rough measure of cognitive function and subtle changes in cognitive function may not be detectable46. The stepwise and late improvement of trail making tests A and B as well as the difference between them is difficult to interpret. Although both tests are sensitive to practice effects the RCI values indicated that the observed changes were indeed clinically significant meaningful and gave no support for such practice effects47.
Although the cognitive decline observed in AF has been attributed to stroke and silent cerebral infarcts, and treatment with OAK has been associated with reduced risk for dementia9, the late onset of improvement in cognitive function in the present study does not favor silent ischemic lesions undetectable by MR as a plausible explanation. Even though transient cerebral hypo-perfusion, mental stress during AF episodes and the gradual recovery of the left atrial contractile function are potential explanations of this improvement, these changes should be interpreted with caution, as all TMT scores were normal. In support for such mechanistic explanation is, however, the observation of longer TMT-A and TMT-B times for patients with previous history of persistent AF versus those with paroxysmal AF or recent onset AF history, which is further consistent with another study showing an association between cognitive decline and AF progression48. Whether the improved cognitive function after CV reflects a restitution of cerebral perfusion following regain of atrial function warrants further studies.
The present study was a small prospective observational cohort, which related to its low number of included patients may limit and underestimate the true incidence of silent TE events detected by MRI in this population. Calculation of the sample size was mainly based on events from cardiac interventional procedures, as there were no other data available when the study protocol was written, which may have overestimated the risk for silent TE events. Moreover, initiation of OAC after CV in 18.6% of the population may be a confounding factor.
In conclusion, even though the absence of new acute lesion on the sequential MRI may suggest that patients with very low thromboembolic risk could be cardioverted without prior anticoagulation at a short time interval after arrhythmia onset, the high incidence of white matter hyperintensities and the transient increase of cerebral damage biomarker, may heighten the need to reevaluate thromboembolic risk stratification. Further studies are needed to elucidate if pharmacological cardioversion or a shorter time frame for cardioversion of recent onset atrial fibrillation confer a protective role regarding cerebral damage.


