Stretch and Inflammation- Their Relation to Fractionation of Electrograms in Atrial Fibrillation
UMA SRIVATSA MBBS1, MARY CHAVEZ CVT1, SANKAR KRISHNAMURTHY PH.D2, ZHONGMIN LI PH.D1, HONG QIU PH.D1, NIPAVAN CHIAMVIMONVAT, M.D.1
1Division of Cardiovascular Medicine, University of California Davis.2Lovely Professional University, Punjab, India.
Inflammatory markers (IM) are elevated in atrial fibrillation (AF). However the relation of IM to substrate modificationinAF remains unclear.We sought to assess the relationship of IM to fractio ated atrial electrogram (FAE) in patients undergoing AF ablation.
At baseline, left atrial (LA) pressure was recorded and peripheral blood was tested for IM. FAE mapping wasperformed before and after circumferential pulmonary vein and linear ablation (CPVA-L) and followed by FAEablation. Image processing was used to define the FAE areas. AF cycle-length (AFCL) was compared between baseline and after ablations from left atrial electrode.
Older patients had higher cytokine levels. FAE area at baseline (secondary FAE) negatively correlated with the levels of interleukin-6 (IL-6, R2= -0.97 and p=0.03) and interleukin-12p70 (IL-12p70, R2= -0.97 and p=0.03). In addition, a significant reduction in FAE area and index occurred after CPVA-L (p=0.0001). FAE after CPVA-L (primary FAE) correlated with left atrial pressure (LAP), [R2 0.5, (p=0.02)]. The AFCL (in msec) increased from 135 ± 41 to 149.5+30 (p=ns) after CPVA-L and further increased to 191.5 ± 60 (p=0.007) after FAE ablation.
There is a negative correlation of IL-6 and IL-12p70 to baseline FAE, suggesting a possibility of sequestration of these cytokines in left atrium. CPVA-L ablation reduces FAE area which when ablated increases AFCL, suggesting that these areas likely represent primary fragmentation due to rotors, triggered by atrial stretch as seen by the relation of left atrial pressure and post CPVA-L FAE.
Correspondence to: Uma N Srivatsa MBBS, MAS, FACC, FHRS, 4860 Y Street, Ste 2820, Sacramento, CA, 95670.
Atrial Fibrillation (AF) is the most common ar- rhythmia and is associated with a significant risk of embolism and stroke. Moreover, the prevalence of AF is expected to increase substantially in the next few decades due to the aging population.1 While pathogenesis of triggers are well under- stood, persistence due to substrate modification is less clear.2-5 In early studies with intra-operative mapping, Konings found complex signals at sites of slow atrial conduction where there were func- tional blocks enabling wavelets to pivot.6 These areas could represent either continuous re-entry phenomenon of fibrillatory waves or overlapping segments of adjacent wavelets, and these were called Complex Fragmented Atrial Electrogram (CFAE).6 These have been shown to be present in the left atrium with spatial and temporal stability during AF, and could represent substrate modifi- cation.7-10 CFAE has been defined as fractionated electrogram (EGM) in the atrium composed of two or more deflections and/or perturbation of the baseline with prolonged activation complex over a 10-s recording period, or an atrial EGM that has a very short cycle length (≤120 ms) averaged over a 10-s recording period. Nademanee et al. showed that these CFAE signals are present in select areas of the atrium - around pulmonary veins as well as in the roof, septal and mitral annular areas of the left atrium.10 Automated algorithms have been developed (Endocardial solutions Inc (ESI), and CARTO software systems), which take into ac- count the duration, amplitude and inter-EGM interval displayed as color coded signals. These color signals can be quantified using an image processing technique. Whether ablation of these areas are beneficial to the patient has been con- troversial, leading to the quest to differentiate pri- mary fractionation from rotors and secondary frac- tionation from slowing of conduction.10,11 Recently in a brilliant study by Narayan et al., the authors showed four different types of fractionated atrial electrograms (FAE) by assessment of monophasic action potential (MAP). Those with discrete MAPs, and shorter cycle length were concentrated near the pulmonary veins and posterior left atrium.12
Previous studies have demonstrated the corre- lation of inflammatory markers (IM) with de- velopmental risk and persistence of AF.13 More- over, in patients undergoing AF ablation, there is a trans-cardiac gradient of interleukin-6 (IL-6)and C-reactive protein (CRP) levels.14
To directly test the central hypothesis that there is a linkage between inflammation and substrate modi- fication in AF, we assessed the relation of IM to area of FAE signals. To differentiate whether FAE areas are involved in the pathogenesis of AF, we com- pared AF cycle length (AFCL) before and after cir- cumferential pulmonary ablation with linear lines (CPVA-L) as previously described as well as before and after ablation FAE.15 To identify whether atrial stretch could cause the initial trigger, we assessed the relation of left atrial pressure (LAP) to primary frag- mentation that was revealed after CPVA-L ablation.
The study protocol was approved by the UC Davis Institutional Review Board. Patients presenting to the electrophysiology laboratory for ablation were enrolled in the study after consent, if they were in AF. At baseline, blood was drawn from a periph- eral vein and tested for the levels of inflammatory markers (IM). After trans-septal punctures, left atrial pressure (LAP) was recorded, pulmonary vein mapping (Lasso, Biosense Webster Inc.) and thermo-cool (3.5 mm open irrigated Biosense-Web- ster Inc.) ablation catheters were placed in the left atrium. Electro-anatomic and FAE mapping were performed with lasso and ablation catheters, us- ing ESI Navix software. The software consists of an algorithm wherein the intervals between elec- trograms and duration of the short interval electro- grams are color coded and displayed on the screen.
A minimum time interval between electrogram deflections of 20 msec was selected as the refracto- ry period in the software in order to avoid double counting of the electrograms. Low and high cut- off values, 50 and 120 msec electrogram intervals respectively, were chosen as measurements of FAE boundary. Those areas between the 20msec and 50 msec interval appear white, and those above 120 msec intervals appear purple. The intermediate intervals appear in various shades of color as programmed by the manufacturer. EGMs were recorded for at least 4 seconds at each point. CPVA-Lablation was performed,15 if patients remained in AF, FAE maps were reconstructed and additional ablation of these areas was performed. Patients still remaining in AF were then cardioverted to normal sinus rhythm. We excluded patients who were in sinus rhythm when they presented to the electrophysiology laboratory, those patients with-out good quality FAE maps, and those with active infection or chronic inflammatory process. Mean AFCL was assessed by recording intra-cardiac EGM from a Prucka recording system at 100 mm/sec speed for 2.4 sec. AFCL was averaged for all the EGM intervals recorded during this period (17 ± 6 cycles) from left atrial coronary sinus electrodes.
Inflammatory marker analysis
Plasma samples were collected and stored at -70°C until assayed. Plasma IM was analyzed using a Cytometric Bead Array kit (CBA human inflammation kit, BD Biosciences). Briefly thawed plasma samples were mixed for 2 hours at room temperature with florescence-labeled capture beads with the detection reagents to measure the concentrations of Interleukin-6 (IL-6), Interleukin-1ß (IL-1ß),Interleukin-8 (IL-8), Interleukin-10 (IL-10), Tumor Necrosis Factor-α (TNF-α) and Interleukin-12p70 (IL-12p70). Samples were then washed with buffer and analyzed on a FACS can flow cytometer (BD Immunocytometry Systems). Data was analyzed using BD Cytometric Bead Array Analysis software (BD Immunocytometry Systems). Measurements were performed by an investigator blinded to the patients’ clinical characteristics.
Image Processing for quantification of FAE
Digital image processing is a method used to ex- tract cues from pictures and satellite images. Pic- tures are converted to a rectangular grid of pixels using a process known as digitization or rasterization. The pixels are then processed using tech- niques such as segmentation, thresholding and histogram, which are automated algorithms available on the ADOBE Photoshop CS4 ver11.0 ( Adobe Sys- tems Inc.) software, to isolate areas of interest and boundaries of objects.16 These techniques have been extensively applied in the medical field to detect tumors and other conditions in patients. We used this method to quantify FAE area (FAEA) from the map obtained during ablation. All FAE maps ob- tained by CFAE software (ESI Inc.), were stored as an image file for analysis using Adobe photoshop software. FAEA from the roof, septum, anterior wall, posterior wall, base, pulmonary veins and lat- eral wall were quantified, by outlining regions with purple color which represent normal area (NAr ). Then the entire left atrium was outlined to calculate the total area (TA). FAEA is calculated by subtrac- tion of normal area from the total area (TA-Nar ). Fractionated Area Index (FAI) was calculated as the percentage of FAEA to the total area (TA-Nar/TA x100) to avoid variations related to gain in the im- age display. The measurements were performed by the investigator who was blinded to clinical data.
Continuous data are presented as mean ± S.D and categorical data as proportions. Paired comparison was performed for statistical comparison of repeated measures. Linear regression was used to assess correlation of IM and FAEA. Correlation was consid- ered significant if p < 0.05. All data analyses were performed using SAS version 9.1.3 (Cary, NC).
Twenty one patients undergoing ablation, with AF as the presenting rhythm, were included in the study. AF history was present for a duration of 46 + 33 months. Six were excluded due to poor quality maps. Of the 14 patients, six patients con- verted to sinus rhythm after CPVA-L and the rest had FAE map repeated and these areas were tar- geted for ablation. Eleven patients had adequate blood samples available for IM analysis. Base- line characteristics of the patients are described in (Table 1) including the levels of IM. Mean age was 61.5 ± 8.1 years and 75% of the patients were male. A majority of the patients had a history of hypertension, had a left atrial size of 46.9 ± 8.1 mm and a mean LAP 14 + 6 mm Hg. Eleven of them were on anti-arrhythmic agents; all anti-ar- rhythmic drugs except amiodarone were stopped five half lives before the procedure. There was no significant difference between the baseline TA in the pre- and post-ablation maps, thus validating the consistency of the image processing analysis. At baseline, the mean FAEA was 130.7 ± 51.7 K pixels, FAI was 46.7 ± 15.1% and AFCL was 135± 41 msec. There was no significant correlation between pre-ablation FAEA, FAI or AFCL to the covariates - gender, age, hypertension, diabetes, duration of AF, body mass index (BMI), left ven- tricular ejection fraction (LVEF), left atrial size or anti-arrhythmic therapy. Age of the patients positively correlated with the levels of IL-8, IL10, TNF-α and IL-6, IL12p70 (p<0.05) (Fig1A and B). In addition, in patients who failed to convert after CPVA-L (n=5) in who IM was available, there was a negative correlation noted between baseline FAEA and IL-6 (R= -0.97, p=0.03) and IL-12p70 (R= -0.90, p=0.03) (Fig 2). After CPVA-L, there was a signifi- cant reduction in FAEA from 130.77 ± 52 to 57.45±
Table 1. Baseline Patient Characteristics
| Total number of patients |
14 |
| Age (years) |
61.5+ 8.1 |
| Gender |
75% male |
| Hypertension |
75% |
| Diabetes |
25% |
| Left atrium size (mm) |
46.9 ± 8.1 |
| LVEF |
61± 5% |
| Duration of AF (months) |
45.3 ± 33 |
| AARx |
42.8%% |
| IL-8 (pg/ml) |
18.8 ± 8.9 |
| IL-1β (pg/ml) |
15.6 ± 5.3 |
| IL-6 (pg/ml) |
15.0 ± 5.6 |
| IL-10 (pg/ml) |
13.7 ± 3.4 |
| TNF-α (pg/ml) |
21.3 ± 1.94 |
| IL-12p70 (pg/ml) |
32.1 ± 5.7 |
Figure 1A Correlation of age and IL-6 levels is shown at baseline. R2= 0.4, (p=0.04)
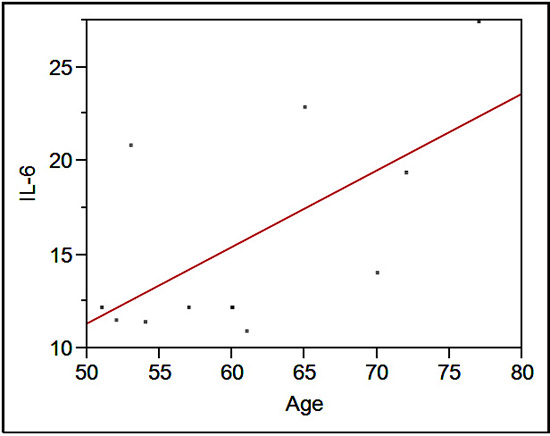
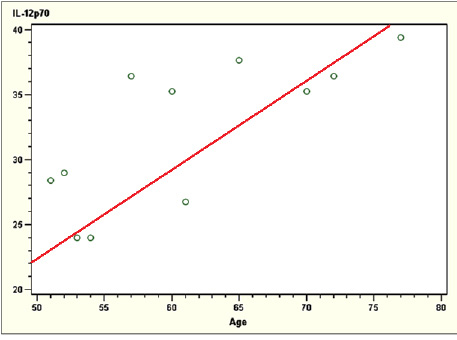
Figure 1B Correlation of age and IL-12p70 levels is shown at baseline. R2= 0.74, (p=0.01)
62 K pixels (56% reduction) (p=0.0002) and FAI from 46.7 ± 15.1% to 20.8 ± 18% (p=0.0001) (Table 2,Fig 3A and 3B). The LAP correlated better with FAEA after CPVA-L [R2 0.5, (p=0.02)] than FAEA before CPVA-L [R2 0.3, (p=0.05)] (Fig 4A & Fig 4B) but not to IM levels. Subsequently, the eight patients remain- ing in AF had ablation of the FAEA. After CPVA- L, the AFCL increased from 135 ± 40.8 to 149.5±30 (p=ns) and after FAE ablation, the mean AFCL increased further to 191.5 ± 60 msec (p=0.007).
The pathophysiology of AF is complex and is linked to electrical remodeling of the atrial tissue including reduced atrial refractory period, loss of rate adaptation, prolongation of atrial conductivi- ty, as well as structural remodeling such as LA dil- atation and fibrosis.17 There are many clinical stud- ies showing a relation of IM to AF. In the study by Henningsen et al. C-reactive Protein (CRP) and IL-6 levels were elevated in patients with persis- tent AF.18 In the prospective Cardiovascular Health Study, patients with CRP in the fourth quartile had an odds ratio of 1.8 for development of AF.19 El- evated levels of IL-8 have been shown in patients with permanent AF. The source of the inflamma- tory
Figure 2 Negative correlation of IL 6 (R=-0.97, p=0.03) and IL-12p70 (R=-0.90, p=0.03) with pre ablation FAEA (Path Pre in the figure)
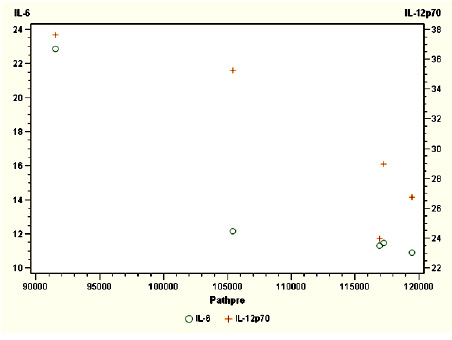
FAEA- Fractionated Atrial electrogram Area in pixels. IL6 and Il12p70 are expressed in pg/ml. cytokines (IC) is likely from a systemic site, as levels were elevated in peripheral venous blood but not in pulmonary veins.20 In patients undergoing AF ablation, higher levels of IL-6 and CRP were present if patients were in AF, and these markers seem to be sequestrated in the heart as seen by the trans-cardiac gradient between systemic and coronary sinus blood. Thus it has been established that inflammation has a role in the pathogenesis of AF.
In our study, age correlated with the levels of IM. Ageing is a well known risk factor for the occurrence of AF, as well as increased morbid- ity and mortality.21 Ageing has been associated with enhanced release of cytokines and there- fore has been attributed to many age-related illnesses such as cancer. Enhanced cytokine release is due to COX-2 (cycloxygenase 2)-me- diated release of PGE2 (Prostaglandin E2) and up-regulation of NF-ĸB (Nuclear Factor-ĸB).22,24
In this study, we also show that there is a nega- tive correlation of IL-6 and IL-12p70 to baseline FAEA. This is an unexpected finding, contrary to our hypothesis. To conclude that there is no role for inflammation, there should be no relation
Table 2. Comparison of pre- and post-ablation data from FAE mapping (n=8)
|
Pre-Ablation |
Post-CPVA-L ablation |
Post FAE ablation |
P |
| All areas (K Pixels) |
293.17 ± 91.3 |
277.1 ± 91.6 |
0 |
#ns |
| FAEA (K Pixels) |
130.7 ± 51.7 |
57.45 ± 62 |
0 |
#0.0001 |
| FAI (%) |
46.7 ± 15.1 |
20.8 ± 18 |
0 |
#0.0001 |
| AF CL (msec) |
135 ± 40.8 |
149.5 ± 29.5# |
191.5 ± 60.1* |
#ns *0.007 |
Data presented are mean ± S.D.; FAEA, Fractionated atrial electrogram area; FAI, Fractionated atrial electrogram Index; AFCL- Atrial fibrillation cycle length; # Comparing Pre-ablation and Post CPVA-L; *Comparing Pre-ablation and POST FAE ablation. that there is no role for inflammation, there should be no relation
whatsoever. However due to this negative relationship, we attempt at an explanation. The role of IL-6 is multi-factorial. Once produced, they can be both pro- and anti-inflammatory. IL-6 has been shown to not only stimulate production of acute phase proteins such as CRP, but also to elicit hu- moral and cellular response and may represent a key factor in the transition from acute to chronic inflammation.24-26 On the other hand, when com- pared to IL6
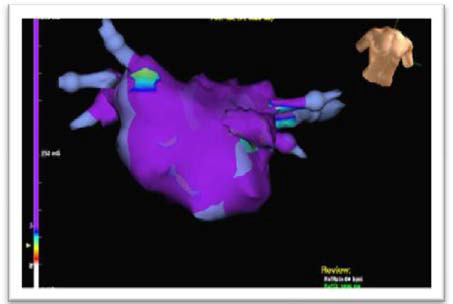
Figure 3A Fractionation at baseline
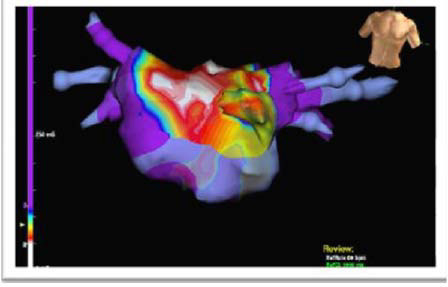
Anterior view of left atrium with automated complex fragmented electrogram (FAE) map. Map was per- formed pre-ablation while patient was in atrial fibrillation (AF). Anterior view of the left atrium, purple area represents absence of FAE signals with electrogram cycle length (CL) > 120 msec .White areas indi- cate areas with CL between 20-50 msec, and transition colors are areas with CL between 50-120 msec
Figure 3B Fractionation after CPVA-L ablation (see text for details)
Post CPVA-L ablation FAE map in anterior view of left atrium showing significant reduction of abnormal area with predominant purple color representing electrogram cycle length > 120 msec . +/+ mice, IL6 -/- mice have enhanced production of inflammatory cytokines in response to endotoxin and have higher mortality thus sug- gesting the anti-inflammatory effect of IL-6.27 IL-12
family of cytokines is a major regulator of T cell response in inflammation. The molecule contains two subunits, p35 and p40, which together form the bioactive IL-12p70.28 When produced by mac- rophages and monocytes, they activate and differ- entiate T cells. Macrophages have been document- ed to be present in atrial tissue samples obtained during cardiac surgery in patients with AF.29 It is possible that paroxysmal episodes of AF trigger interleukin production which in turn sets into mo- tion a chronic inflammatory process in the atrial myocardium. Recurrent episodes of AF may cause cumulative changes leading ultimately to persistent AF. Chronic immune cells express IL-10, an anti-inflammatory cytokine which inhibits NF-ĸB resulting in decreased production of inflammatory cytokines such as IL-6.30,31 Indeed, the negative cor- relation between baseline FAEA and IL-6 as well as IL-12p70 could perhaps be explained by this chron- ic inflammatory state. On the other hand, IL-6 and IL-12 p70 could be sequestrated in the heart and inflammation likely slows down local conduction, resulting in fractionation in wide areas of the atri- um. This relation was not seen in patients who con- verted to sinus rhythm after CPVA-L ablation. But to truly conclude that sequestration is the reason for this negative correlation, further studies are re- quired to assess trans-cardiac gradient of cytokines.
CPVA-L ablation eliminated the majority of FAEA suggesting that these abnormal areas are due to secondary fractionation present in about half of the left atrium, while ablation revealed those pri- mary fractionated areas in about a fifth of the left atrium, which when
Figure 4A Correlation of LA pressure to FAEA (Path pre) is shown . R2= 0.3, (p=0.05)
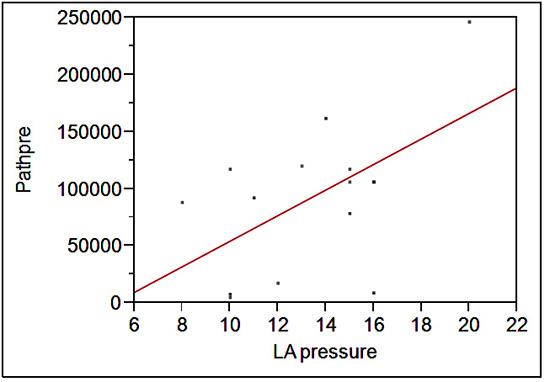
X axis reveals LA pressure and Y axis represents area in pixels.
Figure 4B Correlation of LA pressure to FAEA (Path pre) is shown . R2= 0.3, (p=0.05)
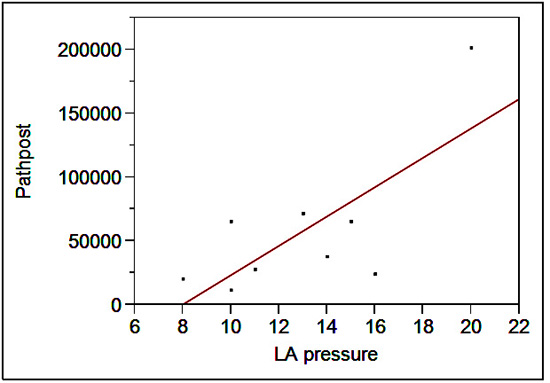
X axis reveals LA pressure and Y axis represents area in pixels. FAEA- Fractionated Atrial electrogram Area
ablated caused prolonga- tion of AFCL. Similar to other studies, we found primary fragmentation mostly around pulmonary veins and posterior wall of LA. We could not establish a relation of inflammatory markers to these primary fragmented regions. The rela- tion of inflammation to fractionation in AF may represent a new paradigm shift in our under- standing of the pathogenesis supporting the well documented phenomenon of “AF begets AF”.
We have also shown a correlation of LAP to FAEA after CPVA-L. Patients with congestive heart failure have an AF prevalence of 20-40% which increases morbidity and mortality.32 Though the mechanism is not clearly understood, it is assumed to be due to elevated LAP stretching the atrial chamber, causing chamber dilation.33 It has been shown that acute atrial dilation causes activation of stretch-ac- tivated cation (I-Sac) current and increases suscep- tibility to AF.34 It is also of note that volume over- load of the left ventricle due to mitral regurgitation is pro-inflammatory and is reversed by surgical correction of the primary cause.35 Similar mecha- nism could be proposed for AF in the presence of high LAP. Elevated LA pressure initiates AF due to primary fragmentation and likely triggers local inflammation resulting in secondary fragmenta- tion and worsening of AF. Recently Lin et al. have shown that elevated CRP levels indicate failure of ablation, which corroborates with our theory.36
Our study is limited by the small number of pa- tients; nonetheless, to our knowledge this is the first study to assess the relation between IM, atrial stretch due to elevated LAP and substrate changes in AF. Measurement of AFCL was per- formed from left sided coronary sinus electrodes, and may not be accurate as conduction delays due to ablation could have lengthened the AFCL.
In conclusion, there is a negative correlation of IL-6 and IL-12p70 to baseline FAE, suggesting a possi- bility of sequestration of these cytokines in left atrium. CPVA-L ablation reduces FAE area which when ablated increases AFCL, suggesting that these ar- eas likely represent primary fragmentation due to rotors, triggered by atrial stretch as seen by the re- lation of left atrial pressure and post CPVA-L FAE.
Uma Srivatsa was supported by Mentored Clinical Research Training Program through the UC Davis Clinical and Translational Science Center. Hong Qiu is supported by an American Heart Association Western Affiliates Postdoctoral Fel- lowship Award. Nipavan Chiamvimonvat is supported by the Department of Veteran Affairs Merit Review Grant and the National Institutes of Health Grants (HL85844, HL85727).


