Natural History of Implantable Cardioverter-Defibrillator Implanted at or after the Age of 70 years in a Veteran Population: A Single Center Study
Tarek Ajam12, Vikas Kalra12, Changyu Shen3, Xiaochen Li3, Sandeep Gautam4, Thomas Kambur12, Mamta Barmeda5, Kyle W Yancey6, Samer Ajam12, Jason Garlie12, John M Miller12, Rahul Jain12
1Division of Cardiology, Department of Medicine, Richard L Roudebush Veterans Affairs Medical Center, Indianapolis, IN;.2Division of Cardiology, Indiana University School of Medicine, Indianapolis, IN;.3Department of Biostatistics, School of Medicine and Richard M. Fairbanks School of Public Health, Indiana University, Indianapolis, IN;.4Division of Cardiovascular Medicine, University of Missouri, Columbia, MO;.5Indiana University School of Allied Health Sciences, Indianapolis, IN;.6Division of Cardiovascular and Thoracic Surgery, Indiana University School of Medicine, Indianapolis, IN..
The median age of patients in major Implantable Cardioverter-defibrillator (ICD)trials (MUSTT, MADIT-I, MADIT-II, and SCD-HeFT) was 63-67 years; with only 11% ≥70 years. There is little follow-up data on patients over 70 years of age who received an ICD for primary/secondary prevention of sudden cardiac death, particularly for veterans.
The aim of this study was to study the natural history of ICD implantation for veterans over 70 years of age.
We retrospectively reviewed single center ICD data in 216 patients with a mean age at implantation 76 ± 4 years. The ICD indication was primary prevention in 161 patients and secondary prevention in 55 patients. The ICD indication was unavailable in 4 patients.
Mean duration of follow up was 1686 ± 1244 days during which 114 (52%) patients died. Of these, 31% died without receiving any appropriate ICD therapy. Overall, 60/216 (28%) received appropriate therapy and 28/216 (13%) received inappropriate therapy. Patients who had ICD implantation for secondary prophylaxis had statistically more (p= 0.02) appropriate therapies compared to patients who had ICD implantation for primary prevention. Indication for implantation and hypertension predicted appropriate therapy, while age at the time of implantation and presence of atrial fibrillation predicted inappropriate therapies. Overall, 7.7% had device related complications.
Although 28% septuagenarians in this study received appropriate ICD therapy, they had high rates of mortality, inappropriate therapy, and device complications. ICD implantation in the elderly merits individualized consideration, with higher benefit for secondary prevention.
Correspondence to: Address for Correspondence:Rahul Jain MD, MPH
Assistant Professor of Medicine
Indiana University
1800 N. Capitol Ave., E-488
Implantable cardioverter-defibrillator (ICD) is associated with reduction in arrhythmic death when implanted for either primary or secondary prevention of sudden cardiac death. [1], [2], [3], [4], [5]. More than 100,000 ICDs are implanted in the United States (US) annually, [6] with the majority of these (about 75%) implanted for primary prevention. [6] The mean age of patients receiving new implants is 66 + 13 years and 43% of the new implants occur in patients > 70 years of age; [6] however, patients >70 years of age are underrepresented in the large clinical trials that have shown ICD benefit as a whole. A subgroup analysis of MADIT-II trial showed mortality benefit of ICD in patients > 70 years of age in multivariate analysis (HR 1.57, 1.02–2.41, p= 0.042). [7] However, other studies have not shown consistent mortality benefit in this population [8], [9], [10]. This is also true in patients receiving an ICD for secondary prevention. [11] With advancing age and comorbidity burden, the relative contribution of noncardiac or non-arrhythmic causes of death [12], [9] may increase compared to younger patients, potentially attenuating the benefits of ICD therapy in older patients. This might be true even for those who have ICD implanted for secondary prevention. The ratio of sudden death to all cause death has been shown to fall steadily from 0.51 before age 50, to 0.26 after age 80, [9] especially in patients with heart failure or following myocardial infarction. Thus, one would expect that elderly survivors of cardiac arrest may benefit less from the ICD than younger patients. This might be especially true in the veteran patient population,which has increased cardiovascular risk factors when compared to the general population.
Procedural outcomes reported in the ≥70 yr age group have also varied considerably with some studies showing increased risk of complications in the elderly [13] while others have contradictory findings [14] . Current guidelines do not address the criteria or prognosis of ICD implantation with advancing age. [8], [9], [10] . Given the considerable variation in the reported data, and lack of specific guidelines for ICD implantation at an advanced age, we sought to look into the long-term survival and procedural outcomes after ICD implantation in the elderly (age > 70 years) veteran population.
We retrospectively studied 4800 patients who were enrolled in the device clinic at the Richard L Roudebush, Veterans Affairs (VA) Medical Center, in Indianapolis, IN. Patients with pacemakers were excluded from the study, leaving 1660 patients who had an ICD, of which 268 had ICD implanted at or after the age of 70 years. Data was incomplete in 48 patients who were excluded from further analysis. Thus, a total of 220 patients were included in the study for analysis. Patients underwent ICD implantation between 1995 and 2014. During the analysis of primary versus secondary indication, four patients were further excluded because data for indication for implantation was missing.
The computerized patient record system (CPRS) database was reviewed for comorbidities at the time of implantation. This also included reading through the scanned data in CPRS for outside medical records. Device recordings of patients who had ICD therapies were reviewed by an electrophysiologist at the time of clinic visit and then adjudicated by a second electrophysiologist (RJ) during the review of records for this study. To clarify disagreement in categorization of stored events those recordings were presented in the morning conference and the consensus agreements were used for analysis.
Comorbidities from the CPRS database were recorded at the time of initial implantation (or within 6 months thereafter). Ejection fraction data was collected through echocardiographic, nuclear medicine, or cardiac catheterization reports within 6 months prior to the date of ICD implantation.
The primary outcomes were all-cause mortality and appropriate ICD therapy (anti-tachycardia pacing {ATP} or shock). Secondary outcomes include inappropriate therapy (ATP or shock), and device-related complications at ≤ 30 days and > 30 days post-implant. Mortality data was collected through CPRS. The European community and the International standards organization have provided standard criteria for adverse events observed during trials with implantable medical devices, defining an adverse event as any undesirable clinical occurrence and taking into account the severity and relationship to the implanted device. [15] In our study, we excluded inappropriate therapies as device related complication (analyzed separately). Adverse events post device implantation included lead or device revisions, infections, hematoma, lead fracture, and device recalls. This was further subdivided into procedure related complications where device recalls were not included.
Continuous variables were summarized by mean (standard deviation) or median (interquartile range) and compared using two-sample T test (if the normality assumption holds) or Wilcoxon rank-sum test (if the normality assumption did not hold). Normality of distribution was determined using the Kolmogorov-Smirnov goodness-of-fit test. Categorical data was summarized by frequency and percentage and analyzed using Fishers exact test.
Distributions of time to death were estimated by Kaplan-Meier method and compared using log-rank test. Distributions of time to appropriate and inappropriate therapies are estimated and compared using the method of sub-distribution hazard [16] . Cox proportional hazard models (for mortality) and proportional sub-distribution hazard models [17] were used to account for baseline covariates. A risk score for total mortality was created using risk factors in the multivariate Cox model, where the score is the linear sum of the products of the risk factor values and corresponding regression coefficients. The score was then rescaled to have a range of 0-100, where a higher score indicates a higher risk of death.
Calculation of risk score
x is the covariate of patient and includes six variables (Age at implant, DM, Hyperlipidemia, Atrial Fibrillation, CAD, COPD). β is the coefficient vector of the cox model for mortality.The linear predictor for each patients is defined as lp= xβ The constant c is defined as C = Maxlp – Minlp/100 Max lp is the maximum value of linear predictor for all patients in the sample set, the Min lp is the minimum value of linear predictor for all patients in the sample set.The risk score is defined as Score= xβ – Minlp/C Then we can get the increment of the risk score when 1 unit increasing on the respective risk factors.All analyses were performed using R 3.0. A two-sided p-value less than 0.05 is considered statistically significant.
A total of 220 patients were included in the study. Baseline characteristics of the study population are shown in [Table 1]. The mean age of the study population was 76 ± 4 years. Except for one patient all were males. 161 (75%) patients had ICD implanted for primary prevention and 55 (25%) patients for secondary prevention. Overall, 119 (55%) patients had diabetes, 209 (96%) patients had hypertension, 186 (86%) patients had coronary artery disease (CAD), 76 (35%) patients had atrial fibrillation. Mean left ventricular ejection fraction (LVEF) at the time of implantation was 28 + 12%. There were 59 (27.3%) patients who had NYHA Class II heart failure (HF) and 85 (39.3%) patients had NYHA Class III HF. Mean GFR was 59 ± 24 ml/min. There were 169 (78.2%) patients taking beta-blockers, 79.2% (n= 171) on ACE-inhibitors or angiotensin receptor blockers (ARBs), 9.7% (n= 22) spironolactone, 61.5% (n= 133) diuretics, 79.2% (n= 171) aspirin, 20% (n=44) dual antiplatelet therapy and 29.1% (n=63) on anticoagulants (primarily warfarin 26.8% {n=63}). Mean follow up was 1686 ± 1244 days. 116 (53%) patients died during this period. At baseline, only atrial fibrillation was significantly different (higher in primary prevention group, 40.4% versus 20%) between the two groups. ([Table 2])
Table 1. Baseline Characteristics of the Study Population
|
Characteristics
|
Patients
|
|
Age (years)
|
76+-4
|
|
Male
|
99%
|
|
Primary Prophylaxis Indication
|
75%
|
|
Secondary Prophylaxis Indication
|
25%
|
|
Diabetes
|
55%
|
|
Hypertension
|
96%
|
|
Coronary Artery Disease
|
86%
|
|
Atrial fibrillation
|
35%
|
|
Left ventricular Ejection Fraction at time of Implantation
|
28+-12 %
|
|
NYHA Class II
|
27.3%
|
|
NYHA Class III
|
39.3%
|
|
GFR at the time of implantation
|
59+-24 ml/min
|
|
Beta Blockers
|
78.2%
|
|
ACE-inhibitors/ARB
|
79.2%
|
|
Spironolactone
|
9.7%
|
|
Diuretics
|
61.5%
|
|
Aspirin
|
79.2%
|
|
Dual Antiplatelet Therapy
|
20%
|
|
Anticoagulation
|
29.1%
|
Table 2. Baseline Characteristics
|
No. of Participants (%) |
|
|
|
|
Characteristics |
Total |
Primary |
Secondary |
P Value |
|
|
(n = 216)
|
(n =161)
|
(n=55)
|
|
|
Age, mean (SD), y
|
76.38 (4.27)
|
76.40 (4.23)
|
76.45 (4.50)
|
0.94
|
|
|
Ischemic
|
|
|
|
|
|
|
Yes
|
191 (88.0)
|
139 (86.3)
|
51 (92.7)
|
0.21
|
|
|
No
|
26 (12.0)
|
22 (13.7)
|
4 (7.3)
|
|
|
|
DM
|
|
|
|
|
|
|
Yes
|
119 (54.3)
|
91 (56.9)
|
28 (50.9)
|
0.44
|
|
|
No
|
100 (45.7)
|
69 (43.1)
|
27 (40.1)
|
|
|
|
Hypertension
|
|
|
|
|
|
|
Yes
|
209 (95.0)
|
156 (96.9)
|
51 (92.7)
|
0.18
|
|
|
No
|
11 (5.0)
|
5 (3.1)
|
4 (7.3)
|
|
|
|
Smoking status
|
|
|
|
|
|
|
Current smoker
|
48 (21.9)
|
36 (22.5)
|
10 (18.2)
|
0.78
|
|
|
Former smoker
|
70 (32.0)
|
52 (32.5)
|
18 (32.7)
|
|
|
|
No smoking
|
101 (46.1)
|
72 (45.0)
|
27 (49.1)
|
|
|
|
History of Hyperlipidemia
|
|
|
|
|
|
|
Yes
|
169 (77.2)
|
126 (78.7)
|
42 (76.4)
|
0.71
|
|
|
No
|
50 (22.8)
|
34 (21.3)
|
13 (23.6)
|
|
|
|
GFR time, mean (SD), ml/min
|
59.8 (21.3)
|
59.7 (21.6)
|
60.3 (20.4)
|
0.88
|
|
|
Chronic Kidney Disease
|
|
|
|
|
|
|
Yes
|
91 (41.5)
|
67 (41.9)
|
24 (43.6)
|
0.82
|
|
|
No
|
128 (58.5)
|
93 (58.1)
|
31 (56.4)
|
|
|
|
Atrial Fibrillation
|
|
|
|
|
|
|
Yes
|
76 (34.5)
|
65 (40.4)
|
11 (20.0)
|
0.0063
|
|
|
No
|
144 (65.5)
|
96 (59.6)
|
44 (80.0)
|
|
|
|
Coronary artery disease
|
|
|
|
|
|
|
Yes
|
186 (84.5)
|
138 (85.7)
|
47 (85.5)
|
0.96
|
|
|
No
|
34 (15.5)
|
23 (14.3)
|
8 (14.5)
|
|
|
|
Chronic obstructive pulmonary disease
|
|
|
|
|
|
|
Yes
|
62 (28.3)
|
43 (26.9)
|
18 (32.7)
|
0.41
|
|
|
No
|
157 (71.7)
|
117 (73.1)
|
37 (67.3)
|
|
|
|
Transient ischemic attack/stroke
|
|
|
|
|
|
|
Yes
|
18(8.2)
|
15 (9.4)
|
3 (5.5)
|
0.37
|
|
|
No
|
201 (91.8)
|
145(90.6)
|
52 (94.5)
|
|
|
Overall Data Analysis for Mortality
Out of 216 patients in the study, 114 (52%) patients died during the follow up duration. Out of 114, 35 (31%) received appropriate ICD therapy and 16 (14%) had inappropriate therapy. On univariate analysis, higher age at the time of implant (HR: 1.07, [CI: 1.03, 1.12], p = 0.002) , DM (HR: 1.66, [CI: 1.14, 2.4], p = 0.008), hyperlipidemia (HR: 1.69, [CI: 1.07, 2.67], p = 0.02), atrial fibrillation (HR: 1.54, [CI: 1.05, 2.27], p = 0.03), CAD (HR : 2.39, [CI: 1.33, 4.28], p = 0.003) and COPD (HR: 1.94, [CI: 1.31, 2.87], p = 0.001) were significantly associated with overall mortality. Age at the time of implant (HR: 1.10, [CI: 1.05, 1.15], p = <0.00010), DM (HR: 1.62, [CI: 1.10, 2.40], p = 0.02), CAD (HR: 2.27, [CI: 1.24, 4.17], p = 0.008) and COPD (HR: 2.40, [CI: 1.60, 3.61], p = <0.0001) were significantly associated with mortality when applied to a model to develop predictors of mortality in our data.
Table 3a. Survival Analysis for all cause mortality
|
Parameters
|
Hazard ratio
|
95% CI
|
p value
|
|
Primary or secondary
|
1.22
|
( 0.81 , 1.84 )
|
0.334
|
|
Age at implant
|
1.07
|
( 1.03 , 1.12 )
|
0.00234
|
|
Ischemic
|
1.13
|
( 0.62 , 2.08 )
|
0.675
|
|
DM
|
1.66
|
( 1.14 , 2.42 )
|
0.00818
|
|
Hypertension
|
2.60
|
( 0.95 , 7.15 )
|
0.063
|
|
Smoking Status
|
1.37
|
( 0.88 , 2.14 )
|
0.159
|
|
1.25
|
( 0.79 , 1.97 )
|
0.343
|
|
Hyperlipidemia
|
1.69
|
( 1.07 , 2.67 )
|
0.0243
|
|
GFR time
|
0.99
|
( 0.98 , 1.00 )
|
0.203
|
|
Chronic Kidney Disease
|
1.43
|
( 0.99 , 2.08 )
|
0.057
|
|
Atrial Fibrillation
|
1.54
|
( 1.05 , 2.27 )
|
0.027
|
|
CAD
|
2.39
|
( 1.33 , 4.28 )
|
0.00339
|
|
COPD
|
1.94
|
( 1.31 , 2.87 )
|
0.000922
|
|
TIA
|
0.94
|
( 0.48 , 1.87 )
|
0.87
|
|
LVEF
|
1.00
|
( 0.99 , 1.02 )
|
0.591
|
DM: Diabetes Mellitus, GFR: Glomerular filtration rate, CAD: Coronary artery disease, COPD: Chronic obstructive pulmonary disease, TIA: Transient ischemic attack, LVEF: Left ventricular ejection fraction.
Overall Data Analysis for Appropriate Therapy
Out of 216 patients, 60 (28%) received appropriate ICD therapies. On univariate analysis, indication for implantation (primary versus secondary) {HR: 0.41, (CI: 0.25, 0.68), p = 0.0005}, and hypertension {HR: 0.37, (CI: 0.16, 0.83), p = 0.016} were significantly associated with appropriate therapy. In a predictive model for appropriate ICD therapy, secondary prevention indication for implantation {HR: 0.43, (CI: 0.26, 0.70), p = 0.0009} and hypertension {HR: 0.37, (CI: 0.15, 0.95), p = 0.039} were the only two variables that predicted appropriate therapy. Patients with a secondary prophylaxis indication had 67 times higher risk chance of receiving appropriate therapy as compared to a primary prevention implant.
Table 3b. Multivariate Analysis for All-cause mortality
|
Hazard ratio
|
95% CI
|
p value
|
|
Age at implant
|
1.10
|
( 1.05 , 1.15 )
|
0.0000682
|
|
DM
|
1.62
|
( 1.10 , 2.40 )
|
0.01438
|
|
Hyperlipidemia
|
1.29
|
( 0.80 , 2.08 )
|
0.29114
|
|
Atrial Fibrillation
|
1.47
|
( 0.99 , 2.17 )
|
0.05559
|
|
CAD
|
2.26
|
( 1.23 , 4.15 )
|
0.00857
|
|
COPD
|
2.41
|
( 1.60 , 3.61 )
|
0.0000248
|
Overall Data Analysis for Inappropriate Therapy
Of the patients 216 patients, 28 (13%) received inappropriate therapies. On univariate analysis, age at the time of implantation {HR: 0.87, (CI: 0.80, 0.95), p = 0.003} and presence of atrial fibrillation {HR: 2.19, (CI: 1.05, 4.6), p = 0.04} were significantly associated with inappropriate therapies. In a predictive model for inappropriate therapy, age at time of implantation {HR: 0.87, (CI: 0.79, 0.95), p = 0.002} and atrial fibrillation {HR: 2.33, (CI: 1.11, 4.89), p = 0.025} remained significant predictors of inappropriate therapies.
Table 4a. Univariate anlaysis for Appropriate therapy
|
Parameters
|
Hazard ratio
|
95% CI
|
p value
|
|
Primary or secondary
|
0.41
|
( 0.25 , 0.68 )
|
0.00045
|
|
Age at implant
|
0.97
|
( 0.91 , 1.04 )
|
0.43
|
|
Ischemic
|
0.99
|
( 0.46 , 2.16 )
|
0.98
|
|
DM
|
1.03
|
( 0.62 , 1.70 )
|
0.91
|
|
Hypertension
|
0.37
|
( 0.16 , 0.83 )
|
0.016
|
|
Smoking Status
|
1.10
|
( 0.61 , 1.97 )
|
0.75
|
|
1.18
|
( 0.63 , 2.20 )
|
0.6
|
|
Hyperlipidemia
|
1.06
|
( 0.59 , 1.93 )
|
0.84
|
|
GFR time
|
1.00
|
( 0.98 , 1.01 )
|
0.54
|
|
Chronic Kidney Disease
|
1.44
|
( 0.87 , 2.37 )
|
0.15
|
|
Atrial Fibrillation
|
0.80
|
( 0.46 , 1.41 )
|
0.45
|
|
CAD
|
1.74
|
( 0.82 , 3.71 )
|
0.15
|
|
COPD
|
1.48
|
( 0.88 , 2.50 )
|
0.14
|
|
TIA
|
0.96
|
( 0.38 , 2.41 )
|
0.93
|
|
LVEF
|
1.00
|
( 0.98 , 1.02 )
|
0.85
|
DM: Diabetes Mellitus, GFR: Glomerular filtration rate, CAD: Coronary artery disease, COPD: Chronic obstructive pulmonary disease, TIA: Transient ischemic attack, LVEF: Left ventricular ejection fraction.
Mortality in Primary Versus Secondary Prevention Group
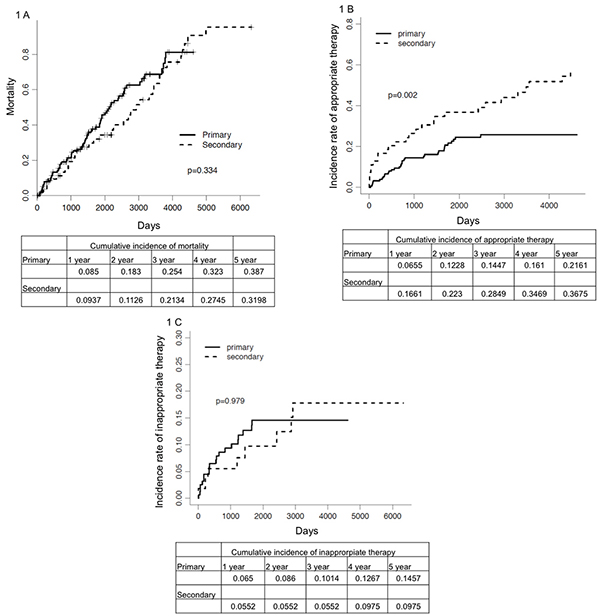
There were a total of 114 (52%) deaths. Out of these, 78 (48%) had received ICD implantation for a secondary prevention indication, while 36 (66%) were primary prevention implants. In patients who had the ICD implanted for primary prevention of SCD, the 1 year mortality was 9% and 5 year mortality was 39%, not significantly different as compared to 9% and 40% in the secondary prevention group.
Table 4b. Multivariate Analysis for Appropriate Therapy
|
Hazard ratio
|
95% CI
|
p value
|
|
Primary or secondary
|
0.43
|
( 0.26 , 0.70 )
|
0.00081
|
|
Hypertension
|
0.37
|
( 0.15 , 0.95 )
|
0.039
|
Appropriate ICD Therapy in Primary Versus Secondary Prevention Group
Of the 60 (27.8%) patients who received appropriate shocks, 33 (20.5%) were in patients who had secondary prophylaxis as the indication for implantation. In patients who had the ICD implanted for secondary prophylaxis, 17% received appropriate shocks in 1 year and 37% within 5 years compared to 7% and 22% respectively for patients who received the ICD for primary prophylaxis. In 55 patients who received ICD for secondary prophylaxis, 36 (65.5%) received an appropriate shock.
Table 5a. Univariate anlaysis for Inappropriate therapy
|
Parameters
|
Hazard ratio
|
95% CI
|
p value
|
|
Primary or secondary
|
0.97
|
( 0.44 , 2.15 )
|
0.95
|
|
Age at implant
|
0.87
|
( 0.80 , 0.95 )
|
0.0029
|
|
Ischemic Cardiomyopathy
|
0.76
|
( 0.26 , 2.26 )
|
0.62
|
|
DM
|
1.63
|
( 0.76 , 3.51 )
|
0.21
|
|
Hypertension
|
1.53
|
( 0.20 , 11.74 )
|
0.68
|
|
Smoking Status
|
0.62
|
( 0.24 , 1.58 )
|
0.31
|
|
1.00
|
( 0.41 , 2.43 )
|
1
|
|
H/o Hyperlipidemia
|
0.62
|
( 0.28 , 1.37 )
|
0.23
|
|
GFR
|
1.01
|
( 0.99 , 1.03 )
|
0.26
|
|
Chronic Kidney Disease
|
0.67
|
( 0.30 , 1.47 )
|
0.32
|
|
Atrial Fibrillation
|
2.19
|
( 1.05 , 4.56 )
|
0.037
|
|
CAD
|
1.63
|
( 0.48 , 5.55 )
|
0.44
|
|
COPD
|
1.26
|
( 0.56 , 2.78 )
|
0.57
|
|
TIA
|
1.23
|
( 0.39 , 3.86 )
|
0.72
|
|
LVEF
|
1.01
|
( 0.97 , 1.01 )
|
0.42
|
DM: Diabetes Mellitus, GFR: Glomerular filtration rate, CAD: Coronary artery disease, COPD: Chronic obstructive pulmonary disease, TIA: Transient ischemic attack, LVEF: Left ventricular ejection fraction.
Inappropriate ICD Therapy in Primary Versus Secondary Prevention Group
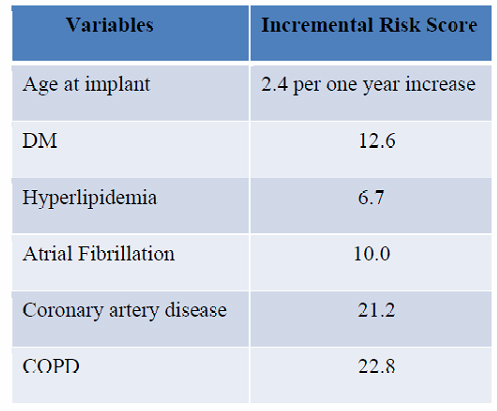
Of the 28 patients who received inappropriate shocks, 20 (12.4%) were in patients who had primary prophylaxis as the indication for implantation and the remaining 8 (14.5%) in secondary prophylaxis patients. In patients who had the ICD implanted for secondary prophylaxis, 6% received inappropriate shocks in 1 year and 10% within 5 years compared to 7% and 15% respectively for patients who received ICD for primary prophylaxis.
Adverse events post device implantation
Twenty-three (10.4%) patients had device related complications. Out of these 23 patients, 13 died, 4 received appropriate therapy and 3 had inappropriate therapy. Two patients had both appropriate and inappropriate therapies. Six patients (23%) had complications on the day of implant, 23% had within 30 days (excluding those who had on the day of implant) and 48% had complications after 30 days of implant.
Excluding device or lead recalls, 17 had complications (7.7%). The complications included infection, hematoma, lead fracture, coronary sinus dissection, right ventricular perforation and lead revision.
Table 5b. Multivariate Analysis for Inappropriate Therapy
|
Parameters
|
95% CI
|
p value
|
|
Age at implant
|
( 0.79 , 0.95 )
|
0.0019
|
|
Atrial Fibrillation
|
( 1.11 , 4.89 )
|
0.025
|
New Risk Score for Overall Mortality
Based on the available data we looked at possible predictors of overall mortality in septuagenarians referred for ICD implantation. A risk score was developed based on the variables that were significant for mortality in multivariable analysis for mortality. The overall mortality based on the risk score is shown in [figure 3a]. To better understand this we can use the following examples:1. A 75 year old patient without any risk variables has a score of 6.2.2. A patient who is 78 years old with diabetes mellitus, no hyperlipidemia, no atrial fibrillation, no CAD and no COPD has a score of 26.3. A patient who is 79 years old with diabetes mellitus, hyperlipidemia, atrial fibrillation, CAD and COPD has a score of 89.The survival curves in can then be used to predict 1 year and 5 year mortality in the above patients.
Figure 3a. Overall mortality for subjects with different risk scores
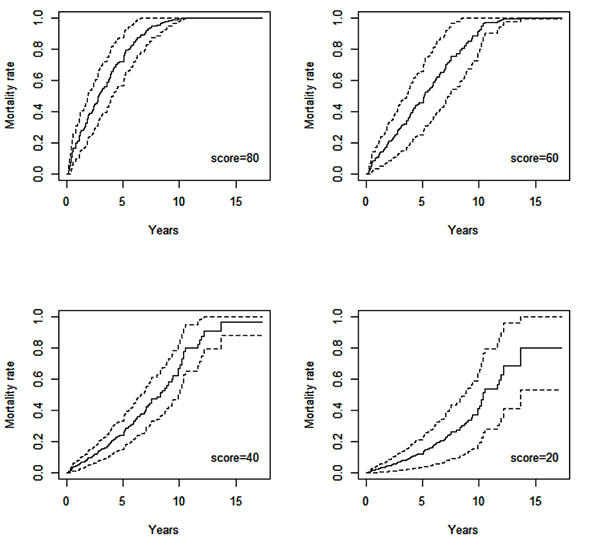
Table 5C. Table 5C
|
1 year Mortality rate and 95 % CI
|
5 year Mortality rate and 95 % CI
|
|
Score=80
|
0.2122
|
( 0.1026 , 0.3217 )
|
0.7207
|
( 0.5672 , 0.8742 )
|
|
Score=60
|
0.1067
|
( 0.0502 , 0.1631 )
|
0.4530
|
( 0.3230 , 0.5830 )
|
|
Score=40
|
0.0505
|
( 0.0210 , 0.0799 )
|
0.2419
|
( 0.1480 , 0.3357 )
|
|
Score=20
|
0.0243
|
( 0.0062 , 0.0424 )
|
0.1234
|
( 0.0501 , 0.1967 )
|
Life expectancy in general population at the age of 70 years is 14.2 years in males and 16.4 years in females [18]. 53% of our study population died during the follow up period of 4 .6 years with 1-year and 5-year mortality being 19% and 71% respectively. This is consistent with other studies with 1-year and 5-year mortality rates of around 20-40 % and 75-80% respectively in patients with heart failure and mean age of >70 years [19], [20]. However, it is significantly different from the 1-year and 5-year mortality in MADIT- 2 trial comparing patients with ICD and no-ICD (8% vs. 10% and 33% vs. 43%) with mean age of 64 years [21] and 5-year mortality in the Sudden Cardiac Death in Heart Failure Trial SCD-HeFT trial comparing patients with ICD and placebo (29% vs 36%) with mean age of 60 years [22].
Table 6. Device Related Complications in the Study Population
|
Patient
|
Indication
|
Age at Implantation
(years)
|
Implant to Death
(years)
|
Age at Death (years)
|
Time to Appropriate Therapy (days)
|
Time to Inappropriate Therapy (days)
|
+/- 1 day of implant
|
< 30 Post Implant Complication
|
> 30 Day Post Implant Complication
|
Complication
|
|
209
|
Primary
|
73.2
|
0.8
|
74
|
|
|
|
Yes
|
|
Hematoma
|
|
133
|
Secondary
|
72.7
|
2.3
|
75
|
|
|
|
|
Yes
|
Infection
|
|
258
|
Primary
|
83.9
|
3.1
|
87
|
|
|
|
|
Yes
|
Lead fracture leading to multiple shocks
|
|
241
|
Primary
|
70.9
|
5.1
|
76
|
791
|
|
|
|
Yes
|
Recall
|
|
254
|
Primary
|
72.3
|
5.7
|
78
|
|
|
|
|
Yes
|
Vegetation on lead
|
|
131
|
Primary
|
77.3
|
6.7
|
84
|
|
63
|
|
Yes
|
|
Hematoma
|
|
194
|
Primary
|
79.1
|
6.9
|
86
|
497
|
1654
|
|
|
Yes
|
Recall
|
|
267
|
Primary
|
72.2
|
7.8
|
80
|
|
53
|
Yes
|
|
|
LV lead dislodgement
|
|
182
|
Primary
|
74.6
|
8.4
|
83
|
|
|
Yes
|
|
|
Device recall
|
|
193
|
Secondary
|
75.6
|
8.4
|
84
|
|
1440
|
|
|
Yes
|
Lead Fracture
|
|
66
|
Secondary
|
78.3
|
8.7
|
87
|
|
|
|
Yes
|
|
Recall-component failure
|
|
273
|
Secondary
|
70.6
|
9.4
|
80
|
191
|
2870
|
|
|
Yes
|
Lead fracture
|
|
260
|
Secondary
|
76.8
|
14.2
|
91
|
4473
|
|
Yes
|
|
|
Lead revision
|
|
41
|
Primary
|
77.4
|
|
|
|
|
Yes
|
|
|
Hematoma
|
|
54
|
Secondary
|
76.6
|
|
|
|
|
|
|
Yes
|
Battery recall
|
|
55
|
Primary
|
86.4
|
|
|
669
|
|
|
|
Yes
|
Battery recall
|
|
65
|
Primary
|
73.1
|
|
|
|
|
|
Yes
|
|
ICD pocket infection
|
|
101
|
Primary
|
75.7
|
|
|
|
|
|
|
Yes
|
LV lead noise
|
|
102
|
Primary
|
81.1
|
|
|
|
|
|
|
Yes
|
Infection
|
|
105
|
Primary
|
77.6
|
|
|
|
|
Yes
|
|
|
CS Dissection
|
|
106
|
Secondary
|
72.4
|
|
|
2424
|
|
|
|
Yes
|
Lead fracture
|
|
122
|
Secondary
|
73.2
|
|
|
|
|
Yes
|
|
|
RV perforation
|
|
129
|
Primary
|
72.2
|
|
|
|
|
|
Yes
|
|
Hematoma
|
|
141
|
Primary
|
75.9
|
|
|
306
|
|
|
|
Yes
|
Battery Recall
|
|
160
|
Primary
|
80.3
|
|
|
|
|
|
Yes
|
|
Hematoma
|
Further, in a subgroup analysis of MADIT-2 trial evaluating 204 elderly patients (aged >75 years) with ischemic cardiomyopathy, there was a non-significant trend towards benefit with ICD therapy (HR: 0.56; 95% CI: 0.29-1.08; P= 0.08). Similarly, subgroup analysis in SCD-HeFT [22] and Comparison of Medical Therapy, pacing and Defibrillation in Heart Failure (COMPANION) studies [23] also showed little mortality benefit. This could be secondary to an increase in non-arrhythmic causes of death with increasing age, which is not prevented by an ICD. [12] , [9] .
Figure 1. Kaplan Meier Curves comparing incidence of overall mortality, appropriate therapies and inappropriate therapies in primary versus secondary indication for implantation.
In our study, age at the time of implant, DM, CAD, COPD and atrial fibrillation was predictors of all-cause mortality. This is similar to the report of Lee et al. [12] that showed age and non-cardiac comorbidities influence survival in the care of ICD recipients. They used administrative data to show that survival after ICD implantation was inversely related to an increasing number of comorbidities. Buxton et [24] also reported a risk stratification and found that NYHA class, conduction disturbance, history of heart failure, LVEF, atrial fibrillation, and age were predictors of mortality. We did not find a difference in mortality in primary versus secondary as indication for implantation. However, the above mentioned comorbidities were associated significantly with mortality.
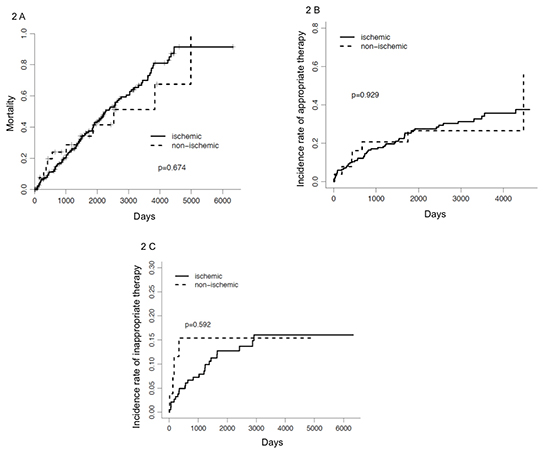
Figure 2. Kaplan Meier Curves comparing incidence of overall mortality, appropriate therapies and inappropriate therapies in patients with ischemic versus non ischemic cardiomyopathy.
In our study, 16.6 % and 22% of patients who had ICD implanted for secondary prophylaxis received appropriate therapy by 1 and 2 years respectively. This is much lower than what has been previously reported in the Antiarrhythmics Versus Implantable Defibrillator (AVID) trial. In that trial, at least one episode of therapy, either ATP or shock, was delivered in 51% of patients at 1 year, censoring patients who had died. [3]
In our study 28% received appropriate therapy and 37% died without receiving any appropriate therapy. Patients who had ICD implanted for secondary prophylaxis were 57 times more likely to receive appropriate therapy compared to when primary prophylaxis was the indication for implantation. For reasons difficult to explain,
Figure 3b. Incremental risk score with different variables.
hypertension was one of the predictors for appropriate therapies. The appropriate therapy rate of 6.5% for primary prophylaxis is similar to the rate reported in the literature [
3], [
2].
In our study, 7.62 % of patients received inappropriate therapy at 2 years, 11% at 45.5 months and 12.9% at 5 years of follow up respectively. This is less than what has been reported in MADIT-II [25] and SCD-HeFT trials [22]. In SCD-HeFT, [22] 17% of patients received inappropriate shocks over a median of 45.5 months of follow-up. Similarly in MADIT-II, 13% of patients had inappropriate shocks during 2 years of follow-up [25]. In these studies, the most common cause of inappropriate shocks in decreasing order of frequency were atrial fibrillation; supraventricular tachycardia; and oversensing caused by lead fracture, T wave oversensing, and electromagnetic interference. In our study, age at the time of implant and presence of atrial fibrillation (AF) were predictors for inappropriate therapies. This is easily understandable. The prevalence of atrial fibrillation increases with age [26] with 2.3% at age 40 years and 5.9% at age 65 years. Approximately 70% of individuals with AF are between 65 and 85 years of age [27]. The finding that atrial fibrillation was a primary reason for inappropriate therapy, combined with the increased prevalence of atrial fibrillation with age, likely explains why we found associations of age and atrial fibrillation with inappropriate therapy.
Overall device related adverse events in our study population was 10.5% which is higher compared to NCDR registry data with complication rate of 5.8% in 2006 to 4.8% in 2010 in patients >65 years of age [28]. However, NDCR doesn’t include device recalls as complications. If device/lead recalls are excluded from adverse events in our study, the complication rate drops to 7.7%, which is still higher than 4.8% mentioned above. Possible reasons for this higher incidence of complications include:1. Infection and hematoma could be secondary to a higher incidence of advanced comorbidities in this age group.2. Immunosenescence has been used to describe loss of immune functions in elderly individuals (> 65 years old). Although the mechanisms leading to immunosenescence are not clear, it has been associated with increased susceptibility to disease, infections, and poor response to treatments and vaccination [29].
There are several limitations of this study. First, it is a retrospective study with a relatively small sample size. A detailed review of the records was done which included review of outside records, which were scanned in the CPRS. However, there could have been some arrhythmia episodes (therapy), which might have been missed and not recorded in the system. The veteran population is special with a different set of comorbidities from the general population and therefore the results of this study might not be generalized to the overall population. We propose a newer scoring system to estimate overall mortality when the patient is first seen in the clinic for an ICD. This needs validation in prospective study.
However, this is an important step for future prospective studies, which might lead to a new section in ICD guidelines, addressing this specific age group
To our knowledge, our study represents the first attempt to look into the natural history of ICDs when implanted at ≥70 years of age in veterans. This is a very special population with multiple different comorbidities. The findings from this study suggest that ICD implantation in the elderly should be given individualized consideration. We believe that current criteria for ICD implantation cannot be fully applied to this age group and prospective studies are needed for better define this age group.


