Use of acoustic cardiography immediately following electrical cardioversion to predict relapse of atrial fibrillation
Paul Erne1, Therese J Resink2, Andrea Mueller2, Michael Coslovsky3, Richard Kobza2, David Conen4,5, Peter Bauer6, Patricia Arand6
1Laboratory of Signal Transduction, Department of Biomedicine, Basel University Hospital and Basel University, Basel, Switzerland.2Department of Cardiology, Luzerner Kantonsspital, Luzern, Switzerland.3Clinical Trial Unit, Basel University Hospital, Basel Switzerland.4Department of Cardiology, Basel University Hospital, Basel, Switzerland.5Population Health Research Institute, McMaster University, Hamilton, Canada.6Inovise Medical, Inc., Beaverton, Oregon, USA.
Predicting atrial fibrillation (AF) recurrence after successful electrical cardioversion (ECV) is difficult. The main aim of this study was to investigate whether acoustic cardiography (AUDICOR® 200) immediately post-ECV might provide indices for AF relapse following cardioversion. Acoustic cardiography parameters included Electromechanical Activation Time (EMAT), Left Ventricular Systolic Time (LVST), QRS duration, heart rate and third heart sound intensity (S3 Strength). We analysed data from 140 patients who underwent successful cardioversion and in whom AUDICOR results and echocardiographic measurements immediately after (baseline) ECV were available. Patients were prospectively followed-up at 4-6 weeks, 3 and 12 months post-ECV, and sinus rhythm maintenance was evaluated using acoustic cardiography and Holter electrocardiography. The effect of each baseline AUDICOR parameter on the hazard of AF relapse was investigated using Cox proportional hazards (PH) models. Fifty patients (35.7%) had AF relapse. Of all the AUDICOR parameters, only S3 Strength exhibited consistent predictive value. Increasing S3 Strength increased the hazard of relapse in a univariable Cox PH model (HR=2.52, p=0.003), and in two multivariable Cox PH model constructions (Model 1 excluded heart rate and Model II excluded EMAT/RR, LVST and LVST/RR) both of which included the parameters as continuous variables (Model I: HR=1.15, p=0.042; Model II: HR=1.14, p=0.045) or the parameters dichotomized according to suggested cut-points (Model I: HR=2.5, p=0.007; Model II: HR=2.09, p=0.031). In conclusion, this study suggests that acoustic cardiography may be a simple inexpensive and quantitative bedside method to assist in prediction of AF recurrence after ECV.
Key Words : Acoustic cardiography, Atrial fibrillation, Electrical cardioversion, Relapse.
Correspondence to: Therese J. Resink, PhD, Department of Biomedicine, Basel University Hospital. Hebelstrasse 20, CH 4031 Basel, Switzerland, email:therese-j.resink@unibas.ch; tel: +41 61 2652422; fax: +41 61 2653250
Atrial fibrillation (AF) is the most common heart rhythm disorder encountered in clinical practice. It is associated with decreased exercise tolerance and substantial mortality and morbidity due to thromboembolic accidents and heart failure.[1] Therapy of AF is primarily aimed at restoration of a regular rhythm so that optimal cardiac output is sustained, risk of stroke reduced and the symptoms are lessened, with the ideal end result being long term maintenance of normal sinus rhythm (SR) to potentially prevent tachycardia-induced myocardial remodelling and heart failure.
In the hospital, external direct current electrical cardioversion (ECV) is the most frequently used and effective method for converting AF to SR. With vigilant attention to cardioversion technique and anti-coagulation, ECV is successful in 80-95% of patients.[2] However, AF recurrence after successful cardioversion is common: around 20-50% of patients suffer from AF recurrences within 2 weeks of cardioversion even if under antiarrhythmic drug therapy, 40-60% of patients relapse into AF within 3 months and 60-80% relapse within 12 months.[2],[3] Reported predisposing factors for AF recurrences include advanced age, AF duration, left atrial enlargement, increased heart rate variability, structural heart disease, hypertension, diabetes and serological biomarkers of inflammation, coagulation activity, cardiovascular stress, myocardial injury, and cardiac and renal dysfunction.[4]-[7] In particular, echocardiographic assessment of left atrial diameter, volume and area have been identified as predictors of AF recurrence.[7] However, all these factors have limited predictive value and are used mainly to direct therapy or advise against the procedure in patients with a high risk of AF recurrence. It remains a matter of debate as to whether and when AF relapses should be treated.
Identification of easy-to-obtain, non-invasive parameters documenting successful cardioversion and potential for AF relapse would facilitate a better management of patients in whom conversion is difficult and/or in whom long-term maintenance of SR is difficult to achieve. This study aimed to identify acoustic cardiography parameters acquired immediately after ECV (i.e. at baseline) that might predict AF recurrence during follow-up and compared their predictive value to echocardiographic measurements. We carried out a 12-month follow-up in patients who were referred for ECV due to AF to examine the association of the acoustic cardiography-and echocardiographic variables with relapse.
The study was approved by the local Medical Ethics Committee. All patients provided written informed consent. A total of 156 patients were referred for ECV to the Luzerner Kantonsspital (Department of Cardiology) for AF-related symptoms. Patients who experienced episodic AF, self-terminating within 7 days, were said to have paroxysmal AF, while patients whose arrhythmia persisted more than 7 days (or required intervention to terminate) were considered to have persistent AF. One hundred and thirty-eight patients had persistent atrial fibrillation and 18 had paroxysmal atrial fibrillation. Eight patients could be converted on improved medical therapies during work up. The remaining 148 patients were elected for ECV.
Electrical Cardioversion Protocol
ECV was performed under sedation with intravenous midazolam or propofol. A biphasic R-wave synchronized shock (Lifepak12, Physiocontrol Ltd, Redmond, WA, USA) was applied to the patients via self-adhesive skin electrodes (TZ Medical Inc., Portland, OR, USA) in an anterior–posterior position. An initial ECV started out with 300 J, and it was repeated until the patient was either in SR or a maximum of 3 shocks were given. In patients not receiving amiodarone or QT prolonging drugs the repeat ECV was performed after intravenous administration of either ibutlide or vernakalant. Patients in whom AF still persisted (n = 6) were considered to have failed ECV.
Acoustic Cardiography (AUDICOR)
Prior to (between 1 to 7 days), and immediately after (within 5-6 min), ECV patients underwent acoustic cardiography (AUDICOR® 200, Inovise Medical, Inc., Beaverton, Oregon, USA) testing. AUDICOR measurements immediately before ECV are defined as “baseline” measurements. Acoustic cardiography consists of recording and algorithmically interpreting simultaneous digital 12-lead electrocardiographic and acoustic signals using dual-purpose sensors placed in the V3 and V4 positions. The technology produces a variety of hemodynamic relevant measurements including the presence and strength of diastolic heart sounds, such as the third (S3) and fourth (S4) heart sound, and it registers systolic properties through the calculation of systolic time intervals, i.e. its proprietary Electromechanical Activation Time (EMAT, defined as the time from Q-wave onset to the mitral component of the first heart sound), Left Ventricular Systolic Time (LVST, interval from the first heart sound to the second heart sound), as well as a Systolic Dysfunction Index (SDI). Those parameters have been shown to correlate well with established measures of cardiac function,[8]-[15] and have proven to provide prognostic information[16],[17] relevant for the optimization of cardiac treatment.[18]-[21] EMAT reflects the time for the LV to generate enough force to close the mitral valve and when prolonged indicates impaired LV function measured by reduced ejection fraction[8], [11] or decreased maximum LV dP/dt in patients in both normal sinus rhythm[12] and atrial fibrillation. [15] S3 Strength is a continuous parameter that correlates with increased LV end-diastolic pressure and echocardiography determined increased E deceleration rate, E/E’ and lower ejection fraction.[11], [13]
Transthoracic Doppler echocardiography was performed according to the guidelines of the American Society of Echocardiography (Philips IE 33, Eindhoven, The Netherlands) before ECV, after ECV and at all follow-up appointments. Measurements included left ventricular ejection fraction, left atrial diameter (long axis view), left atrial area and E/e’ ratio.
Patients were prospectively followed-up at 4-6 weeks, 3 months and 12 months after ECV. Acoustic cardiography was performed using AUDICOR® 200 at every visit. In addition, Holter echocardiography (7 days) was evaluated and success of conversion considered if there was complete absence of AF. Anti-arrhythmic therapy was reduced in patients still in SR at 3 months post-ECV, and for patients still in SR at 12 months post-ECV anticoagulation and beta-blocker therapies were terminated. Not all of the patients returned to our clinic for every follow-up examination due to death (n = 3 within 3 months of ECV; n = 3 within 12 months of ECV), refusal of follow-up (n = 2 and n = 5 at 3 and 12 month follow-ups, respectively) and decision by patients to be followed-up by their referring doctors (n = 40 and n = 54 at 3 and 12 month follow-ups, respectively). This latter patient group was included in the analyses since requisite information on clinical status (e.g. AF relapse or not) was provided to our clinic by the referring doctors.
AUDICOR measurements S4 and SDI were not analysed due to incomplete records for a large proportion of the patients at many of the time-points. The strength of the S4 is not generated in AUDICOR measurements when the rhythm is detected to be atrial fibrillation or atrial flutter. The SDI parameter was introduced in the AUDICOR software mid-way through the study and therefore, not available for the acoustic cardiography tests prior to the software update. Comparison between groups was done using t-test for continuous variables and Fisher’s exact test for categorical variables. The association of AUDICOR parameters with the odds of successful conversion was examined using univariable logistic regressions. AUDICOR variables were included, each in turn, as single, continuous, predictors. A Kaplan-Meier curve was plotted for the probability of time without relapse, with patients lost to follow-up or dead being censored on their last known time. The effect of each AUDICOR parameter on the hazard of AF relapse was investigated using Cox proportional hazards (PH) models. Best cut-points of AUDICOR parameters were suggested as the values which, when splitting patients accordingly, provided the most significant result in a Cox PH model (i.e. lowest p-value). Multivariable Cox PH regression models once with continuous and once with dichotomized variables were used to examine which variables would remain potential/important predictors of relapse when utilizing the linear combination of all AUDICOR variables. Two multivariable Cox PH models were constructed. Since heart rate correlated strongly with three other AUDICOR parameters (EMAT/RR, LVST and LVST/RR), the first multivariable model included the three variables and excluded heart rate Model I), while the second excluded the three correlated variables but included heart rate (Model II). Since exact time of relapse between follow-up visits was mostly unknown, the data could be seen as interval censored. A sensitivity analysis was performed using methods appropriate for the analysis of interval censored data based on the R package “interval”.[22] Results of this analysis did not differ qualitatively from the main results, and thus are not reported. Unless otherwise specified, data are reported as mean values and standard deviations. P< 0.05 was taken as level of statistical significance. Statistical analyses were performed using R version 3.3.2 software.[22]
Of the 148 patients who underwent ECV, cardioversion was documented as successful in 141 (95.2%). In 1 patient ECV outcome was not documented: this patient was excluded from the study analysis. One of the successfully converted patients was also excluded from the study due to missing baseline AUDICOR measurements. Population demographics and baseline echocardiographic measurements for the analysed patient population (n = 146) split by ECV success at baseline are summarized in [Table 1]. Of the 121 patients followed-up at 4-6 weeks 82 (67.7%) were in SR, of the 103 patients followed-up at 3 months 81 (78.6%) were in SR, and of the 82 patients followed-up at 12 months 61 (74.3%) were in SR.
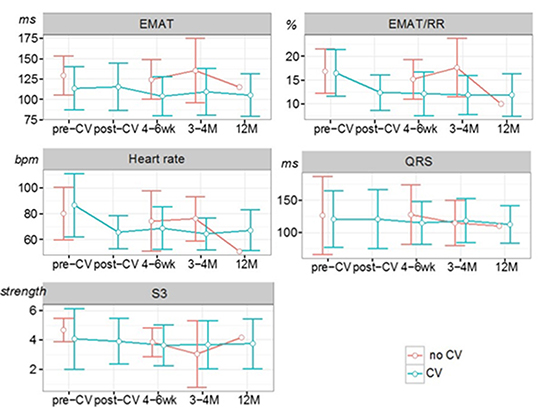
Graphical representations of the descriptive statistics of AUDICOR measurements collected at each time point in the patient subgroups are given in [Figure 1].
Table 1. Demographics and baseline echocardiographic results for the population, overall and split by successful conversion (no CV vs. CV).
|
All |
no CV |
CV |
p |
| N |
146 |
6 |
140 |
|
| Age (years, mean (sd)) |
67.5 (12.5) |
73.9 (4.6) |
66.8 (12.9) |
0.186 |
| Sex = F (%) |
37 (25.0) |
2 (33.3) |
34 (24.1) |
0.635 |
| Persistent AF = persistent (%) |
131 (88.5) |
6 (100.0) |
124 (87.9) |
1.000 |
| Device = ICD (%) |
71 (48.0) |
4 (66.7) |
66 (46.8) |
0.425 |
| LV ejection fraction (%, mean (sd)) |
50.7 (12.8) |
49.3 (15.3) |
50.8 (12.8) |
0.829 |
| LA diameter (mm, mean (sd)) |
43.5 (6.0) |
46.8 (11.3) |
43.4 (6.7) |
0.487 |
| LA area (cm2, mean (sd)) |
26.4 (6.5) |
29.7 (11.6) |
26.1 (6.24) |
0.501 |
| Lateral E/e’ (mean (sd)) |
8.5 (5.0) |
8.2 (3.6) |
8.5 (5.1) |
0.828 |
Comparisons were done using t-test for continuous variables and Fisher’s exact test for categorical variables. AF = atrial fibrillation; ECV = electrical cardioversion; ICD = implantable cardioverter defibrillator; LA = left atrial; LV = left ventricular.
Figure 1. Graphical representation of the descriptive statistics (mean ± standard deviation) of AUDICOR measurements in patient subgroups based on successful (CV) or unsuccessful (no CV) cardioversion. EMAT = electromechanical activation time; RR = R-R interval; S3 = third heart sound.
The effect of each AUDICOR parameter on the hazard of AF relapse was investigated using Cox proportional hazards (PH) models. Only patients who originally had successful ECV and in whom AUDICOR data was collected at baseline (n = 140) were included in the analysis and of these, 50 (35.7%) had AF relapse. [Table 2] summarizes the results of univariable Cox models of the time until first relapse. The effects of increasing 10 units of EMAT/RR equals an approximately 40% decrease in the hazard of relapse, although this trend is not quite statistically significant. The effect of increasing S3 levels was also significant, indicating a significant 16% increase in hazard per S3 unit increase.
Table 2. Summary of the association of AUDICOR variables measured at baseline with the hazard of AF relapse. Estimates from univariable Cox proportional models.
| Variable |
HR |
95% CI |
p |
| EMAT (ms) |
1.02 |
[0.91, 1.14] |
0.767 |
| EMAT/RR (%) |
0.57 |
[0.32, 1.04] |
0.0673 |
| Heart rate (bpm) |
0.86 |
[0.76, 0.97] |
0.0178 |
| S3 Strength |
1.16 |
[1.03, 1.32] |
0.0179 |
| QRS duration (ms) |
1.00 |
[1.00, 1.01] |
0.309 |
The hazard ratios (HR) represent the relative increase (CI = confidence intervals) in hazard per 10-unit increase in AUDICOR variable measurements EMAT and heart rate, or 1 unit for S3 and QRS. EMAT = electromechanical activation time; RR = R-R interval; S3 = third heart sound.
A Kaplan-Meier curve was plotted for the probability of no-relapse [Figure 2]. Based on Cox PH models fit to each observed value of AUDICOR parameter, best cut-points were suggested. [Table 3] shows the distribution of patients, and the number of relapse events in each group, when split according to the suggested cut-point for each AUDICOR parameter as well as echocardiographic measurements at published cut-points (E/e’ at 11,[23] LA diameter at 50 mm,[24] LA area at 30 cm2[25]). The suggested cut-points for AUDICOR parameters LVST and LVST/RR were unrealistic and impracticable; therefore, those results are not presented. This limitation notwithstanding, for the parameters EMAT/RR, QRS duration and S3 Strength there were significant differences in the hazard of relapse when splitting the patients according to the suggested cut-points [Table 4]. Hazard ratios for echocardiographic measurements of LA area, LA diameter and lateral E/e’ are also provided in [Table 4] for comparison with AUDICOR results. [Figure 3] shows the Kaplan-Meier curves for probability of no-relapse when patients are grouped based each time on an AUDICOR parameter’s suggested cut-point.
Table 3. Number of patients and relapse events (%) for each AUDICOR parameter and echocardiographic measurement, split by the applied cut-points.
| Variable |
Cut-point Group |
N patients |
No relapse |
Relapse |
| EMAT (ms) |
< 136 |
121 (86.4) |
79 (65.3) |
42 (34.7) |
|
≥ 136 |
19 (13.6) |
11 (57.9) |
8 (42.1) |
| EMAT/RR (%) |
< 13 |
28 (20.0) |
14 (50.0) |
14 (50.0) |
|
≥ 13 |
112 (80.0) |
76 (67.9) |
36 (32.1) |
| Heart rate (bpm) |
< 103 |
108 (77.1) |
63 (58.3) |
45 (41.7) |
|
≥ 103 |
32 (22.9) |
27 (84.4) |
5 (15.6) |
| QRS duration (ms) |
< 92 |
29 (26.6) |
25 (86.2) |
4 (13.8) |
|
≥ 92 |
80 (73.4) |
46 (57.5) |
34 (42.5) |
| S3 Strength |
< 6.24 |
120 (85.7) |
83 (69.2) |
37 (30.8) |
|
≥ 6.24 |
20 (14.3) |
7 (35.0) |
13 (65.0) |
| LA area (cm2) |
< 30 |
97 (70.8) |
64 (66.0) |
33 (34.0) |
|
≥ 30 |
40 (29.2) |
23 (57.5) |
17 (42.5) |
| LA diameter (mm) |
< 50 |
111 (81.6) |
73 (65.8) |
38 (34.2) |
|
≥ 50 |
25 (18.4) |
14 (56.0) |
11 (44.0) |
| E/e’ratio |
< 11 |
90 (81.1) |
59 (65.5) |
31 (34.5) |
|
≥ 11 |
21 (18.9) |
13 (61.9) |
8 (38.1) |
EMAT = electromechanical activation time; RR = R-R interval; S3 = third heart sound.
Figure 2. Kaplan-Meier estimates (with 95% confidence intervals) of the probability of no relapse.
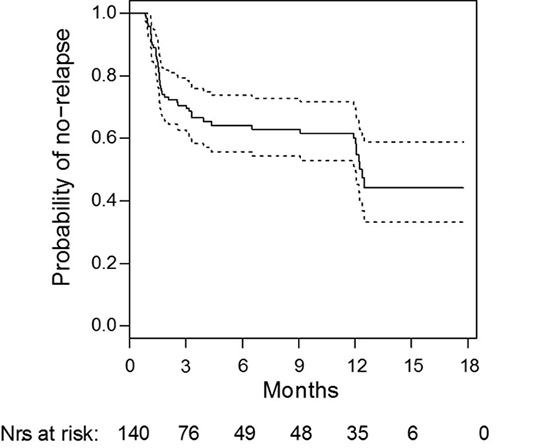
Figure 3. Probability of relapse when grouping patients based on suggested cut-points using Regular Kaplan-Meier estimates. EMAT = electromechanical activation time; RR = R-R interval; S3 = third heart sound.
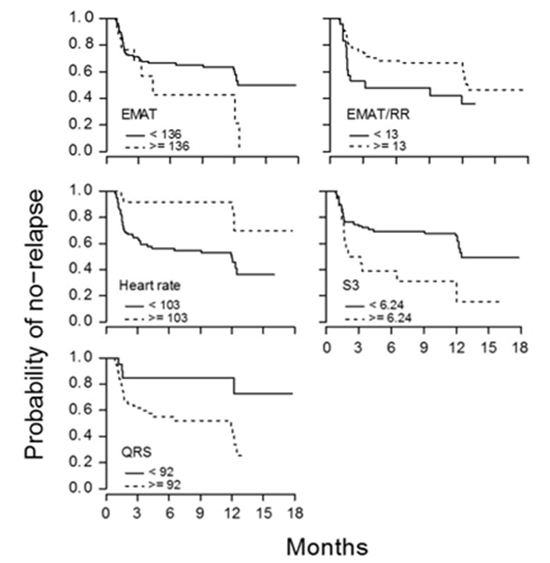
Table 4. Suggested cut-points for AUDICOR parameters and the related hazard ratios (HR) for relapse. Echocardiographic parameters with previously reported cut-points and the related HR for relapse.
| Variable |
Cut-point |
HR |
95% CI |
p |
| EMAT (ms) |
136.00 |
1.30 |
[0.57, 2.97] |
0.498 |
| EMAT/RR (%) |
13.00 |
0.55 |
[0.27, 1.14] |
0.052 |
| Heart rate (bpm) |
103.00 |
0.30 |
[0.16, 0.56] |
0.007 |
| QRS duration (ms) |
92.00 |
4.31 |
[2.20, 8.45] |
0.002 |
| S3 Strength |
6.24 |
2.54 |
[1.09, 5.94] |
0.003 |
| LA area (cm2) |
30.00 |
1.60 |
[0.33, 1.19] |
0.105 |
| LA diameter (mm) |
50.00 |
1.40 |
[0.67, 2.95] |
0.317 |
| E/e‘ ratio |
11.00 |
1.08 |
[0.49, 2.39] |
0.847 |
HR and confidence intervals (CI) calculated from Cox proportional-hazards models. p-values of the related log-rank test provided. EMAT = electromechanical activation time; RR = R-R interval; S3 = third heart sound.
We further used multivariable Cox PH regression models to examine which variables would remain potential/important predictors of relapse when utilizing the linear combination of all AUDICOR variables. Results of the multivariable Cox PH model I with either continuous or dichotomized variables are shown in [Table 5]. A consistent and significant association with hazard of relapse was found only for S3 Strength. Results of the multivariable Cox PH model II with either continuous or dichotomized variables are reported in [Table 6]. This model also yielded a consistent and significant increase in hazard of relapse for increasing S3 Strength. Heart rate showed a significant association with the hazard of relapse only when dichotomized.
Table 5. Results of the multivariable Cox proportional hazards model I including continuous or dichotomized AUDICOR parameters measured at baseline. (Model I excludes heart rate measurements.)
| Variable |
HR |
95% CI |
p |
|
Continuous
|
|
|
|
| EMAT (ms) |
1.09 |
[0.79, 1.49] |
0.607 |
| EMAT/RR (%) |
0.34 |
[0.03, 4.51] |
0.416 |
| LVST (ms) |
0.98 |
[0.83, 1.16] |
0.837 |
| LVST/RR (%) |
1.24 |
[0.51, 3.06] |
0.635 |
| QRS duration (ms) (.imp) |
1.01 |
[1.00, 1.01] |
0.307 |
|
S3 Strength
|
1.15 |
[1.01, 1.31] |
0.042 |
|
Dichotomized
|
|
|
|
| (cut.) EMAT (ms) |
2.11 |
[0.95, 4.69] |
0.066 |
| (cut.) EMAT/RR (%) |
0.54 |
[0.25, 1.13] |
0.100 |
| (cut.) LVST/RR (%) |
0.74 |
[0.24, 2.23] |
0.588 |
| (cut.) QRS duration (ms) (.imp) |
2.21 |
[0.77, 6.36] |
0.142 |
|
(cut.) S3 Strength
|
2.50 |
[1.29, 4.84] |
0.007 |
Missing QRS duration measurements were imputed (.imp) by the median before dichotomization (cut.). Hazard ratios (HR) and 95% confidence intervals (CI) in hazard per 10-unit increase in AUDICOR variable measurements EMAT, LVST and heart rate, or 1 unit for S3 and QRS. p-values determined by Wald test. EMAT = electromechanical activation time; RR = R-R interval; LVST = left ventricular systolic time; S3 = third heart sound.
Table 6. Results of the multivariable Cox proportional hazards model II including continuous and dichotomized AUDICOR parameters measured at baseline. (Model II excludes EMAT/RR, LVST and LVST/RR measurements.)
| Variable |
HR |
95% CI |
p |
| Continuous |
|
|
|
| EMAT (ms) |
0.95 |
[0.83, 1.09] |
0.461 |
| Heart rate (bpm) |
0.88 |
[0.77, 1.00] |
0.054 |
| QRS duration (ms) (.imp) |
1.01 |
[1.00, 1.01] |
0.221 |
| S3 Strength |
1.14 |
[1.00, 1.30] |
0.045 |
| Dichotomized |
|
|
|
| (cut.) EMAT (ms) |
1.72 |
[0.78, 3.79] |
0.177 |
| (cut.) Heart rate (bpm) |
0.34 |
[0.13, 0.88] |
0.027 |
| (cut.) QRS duration (ms) (.imp) |
2.09 |
[0.73, 6.04] |
0.171 |
| (cut.) S3 Strength |
2.09 |
[1.07, 4.09] |
0.031 |
Missing QRS duration measurements were imputed (.imp) by the median before dichotomization (cut.). Hazard ratios (HR) and 95% confidence intervals (CI) in hazard per 10-unit increase in AUDICOR variable measurements EMAT, LVST and heart rate, or 1 unit for S3 and QRS. p-values determined by Wald test. EMAT = electromechanical activation time; S3 = third heart sound.
Introducing simple, objective, and reproducible predictors of ECV success and SR maintenance during follow-up may facilitate the decision-making process concerning the choice of strategy of rhythm or rate control. Duration of AF prior to intervention has been shown to be a predictor of AF recurrence in patients with left-atrial (LA) dilation after ECV[23] and after LA ablation.[24] Echocardiographic measurement of LA diameter >50 mm has also been shown to predict recurrence of AF after LA ablation.[24] These findings are consistent with the expert consensus statement of the European Cardiac Arrhythmia Society which recommends patient selection for atrial ablation including severity of symptoms, age, duration of AF and LA diameter.[26] Other LA properties determined by various imaging modalities have shown promise as predictors of AF recurrence. Fornengo et al found echocardiographic septal E/e’ ratio ≥11 predicted AF recurrence after ECV at 3 months in patients with LA dilation.[23] Also, Hussien et al found pre-procedural BNP, LA area and LV ejection fraction were independently associated with AF recurrence within 24 months in patients who underwent successful radiofrequency catheter ablation.[27] With more advanced imaging, multi-detector computed tomography, Abecasis found LA volume to be a predictor of patients in whom successful AF ablation can be achieved with simpler pulmonary vein ablation procedures.[28] Based on invasive LA pressure measurements, Park et al found low LA compliance was independently associated with a 2-fold higher risk of clinical AF recurrence.[29] Aside from AF duration, these predictors depend upon echocardiography, computed tomography or invasive cardiac catheterization which are expensive and/or invasive procedures thus accentuating the need for noninvasive predictive parameters that can be easily collected and repeated, if necessary.
Diastolic dysfunction can cause LA remodeling that affects LA diameter, volume and pressure and underlying electrical substrate. LA remodeling due to volume overload in exercise training does not appear to increase the occurrence of AF[30] but diastolic dysfunction increases atrial pressure and reduces atrial compliance leading to atrial stretch, myolysis and fibrosis.[31] One theory related to the increased atrial pressure with diastolic dysfunction and resultant pulmonary vein dilation suggests activation of stretch-sensitive signaling pathways near the pulmonary vein may induce ectopic firing and contribute to the occurrence and maintenance of AF.[31] In a study of AF patients with diastolic dysfunction, Hu et al found lower LA voltages possibly due to atrial fibrosis and hypothesize that lower LA voltage might aggravate an interatrial conduction delay resulting in formation of circuits for re-entry.[32] Alternatively, it has been argued that the elevated atrial wall stress with diastolic dysfunction increases atrial fibrosis that electrophysiologically impairs intermyocyte coupling via gap junctions producing fragmented conduction and thus arrhythmia.[33]
Thus, evidence of diastolic dysfunction can be useful to predict those patients who will develop AF as well as those who may have recurrence of AF after ECV or ablation. For example, in a longitudinal study, Tiwari et al found an enlarged LA via echocardiography as a measure of diastolic dysfunction was a significant risk factor of development of AF (moderately enlarged LA 60% higher risk; severely enlarged LA 4.2 times higher risk).[34] Additionally, in a one-year follow-up study of 124 patients undergoing catheter ablation, significant LV diastolic dysfunction (grade 2 or 3) was an independent predictor of recurrence (hazard ratio 2.6, p=0.009) after adjusting for persistent vs. paroxysmal AF and left atrial volume.[35]
The present study found a similar hazard ratio of 2.50, p=0.007, for the acoustic cardiography S3 Strength parameter based on multivariable Cox PH models including AUDICOR parameters dichotomized according to the suggested cut-points. S3 Strength determined by AUDICOR acoustic cardiogaphy has been shown using multivariate analysis to be associated with echocardiographic E/e’[36] a marker for elevated LV filling pressure and therefore atrial pressure. Using invasive measurements of ventricular function, S3 Strength was found to have a positive linear relationship with LV end-diastolic pressure.[37] Thus, abnormally high S3 Strength may be a marker for increased LA pressure, atrial wall stress and resultant atrial remodeling. In addition, in a study of 474 heart failure patients over a mean of 484 days, S3 Strength was found to be an independent predictor of all-cause mortality and significantly lower mortality.[17] In contrast, in a study by Roos et al, EMAT was found to be superior to LV ejection fraction in detecting LV systolic dysfunction defined as reduced LV dP/dt.[12] Therefore, since recurrence of AF is associated with diastolic dysfunction and atrial remodeling due to elevated atrial pressure, it is not surprising that S3 Strength performed better than EMAT or EMAT/RR in this study.
The limitations of the current study include the relatively small size and the use of a referral-based population. The AUDICOR parameters cut-points defined in this study are data-driven and specific to our current population, such that generalization to “all” patients should be done cautiously. On the other hand, the advantage is that all our cut-points for AUDICOR parameters are actually based on data and not on assumptions, which is often the case with some “commonly used” cut-points”. There were no acoustic cardiography measurements after ECV in the patients with unsuccessful ECV. We used Holter monitoring data for the assessment of heart rhythm results. Therefore, asymptomatic AF episodes occurring outside of the Holter recording may have been missed. As time to first recurrence of AF was the central outcome, we used Cox proportional hazards regression to identify risk factors. However, factors influencing the time until AF recurrence may not be constant in time, and thus using “baseline” values does not directly reflect the mechanistic/direct association of these variables and relapse. Another limitation relates to interval censoring. A summary analysis of the follow up times for patients with relapse, without relapse and combined suggested that use of univariate Cox PH models and its results may have been a simplification, as the data could be seen as interval censored. This may explain the observation of sharp drops in probability at around 12 months, likely stemming from the fact that patients returning for follow-up then could not precisely report the time of the relapse. This issue would be compounded by the limited number of follow-ups, so that estimates of HR should be taken cautiously. Nevertheless, a sensitivity analysis (not reported) using current methods for analyzing interval censored data yielded similar results.
Recurrence of AF after ECV or atrial ablation is, unfortunately, quite common and the ability to predict those patients with a high likelihood of AF recurrence is important. Studies using echocardiography, tomography and invasive pressure measurement have documented the relationship between AF recurrence and diastolic dysfunction with resultant atrial remodeling. The current study suggests that acoustic cardiography, a simple, bedside method that does not require specialized technicians, provides a useful marker for AF recurrence in the S3 Strength parameter.
Drs. Bauer and Arand work for Inovise Medical, Inc., the company that provided the acoustic cardiography technology. All other authors have no conflicts of interest to declare.


