Clinical Impact of Saline Volume Infused Through Irrigated-Tip Ablation Catheter in Low Acuity Paroxysmal Atrial Fibrillation Ablation Patients
Nagesh Chopra1, Anish K Amin1, Anand Gupta2, Eugene Y Fu1, Allan J Nichols1, Steven D Nelson1, James M Kleman1, James M Kleman1, Gregory A Kidwell1, Sreedhar R Billakanty1
1
Section of Cardiac Electrophysiology, Department of Cardiology, OhioHealth Heart and Vascular Physicians, Riverside Methodist Hospital, 3535 Olentangy River Road, Columbus, OH 43214, USA.2
OhioHealth Research and Innovation Institute (OHRI), 3545 Olentangy River Road, Suite 310, Columbus, OH 43214, USA.
Radio-Frequency ablation (RFA) to achieve pulmonary vein isolation (PVI) remains mainstay therapy for symptomatic paroxysmal atrial fibrillation (PAF). The clinical consequences of large saline infusions during AF ablation have not been systematically studied. We utilized the differential flow-rates of the two commercially available ablation catheters (AC): ‘ThermoCool’ (TCAC) and ‘Surround Flow’ (SFAC) from Biosense-Webster to evaluate the clinical impact of the saline infused in the immediate post-ablation period.
Consecutive charts of PAF patients between 18 and 81 years who underwent RFA procedure at a tertiary care hospital were reviewed.
Forty-seven patients were included in the study (33Males, 65±11years, LVEF 58±7% and left atrial diameter 44±7.5mm, 23TCAC-use). The saline volume infused through the AC was significantly higher with TCAC vs SFAC use (1277±316vs697±299 ml; p<0.001), with no difference in volume infused from other sources, total procedure or RFA times (p>0.05). This led to significant increase in post-ablation weight gain (96±23 vs 97.5±24kg; p=0.002), furosemide usage (39% vs 0%; p=0.0006), urine production (120±79 vs 63±31ml/hr; p=0.003) and post-RFA potassium reduction (4.4±0.42 vs 4±0.32mmol/l; p<0.001) with TCAC use. Significant post-RFA reduction in magnesium, calcium and creatinine, associated hyperchloremic metabolic acidosis and a modest QTc prolongation were also observed with use of both ACs albeit only moderate to weakly correlated with saline volume infused through the AC. No clinical adverse outcomes were encountered.
Higher saline-volume infusing AC use in PAF ablation causes significant post-ablation weight gain despite higher furosemide use, larger urine production and associated post-RFA potassium reduction without increasing morbidity in lower acuity patients. Furthermore, an array of post-ablation electrolyte disturbances causes a modest and clinically insignificant QTc prolongation.
Key Words : Atrial Fibrillation Ablation, Post Ablation Weight Gain, Irrigated Tip Ablation Catheter, Hypokalemia, Hypomagnesemia, Hypocalcemia.
Correspondence to: Nagesh Chopra,Department of Cardiology, Section of Cardiac Electrophysiology Riverside Methodist Hospital 3535 Olentangy River Road Columbus, OH 43214, USA
Pulmonary vein isolation (PVI) has become the mainstay therapy for anti-arrhythmic refractory or intolerant, symptomatic paroxysmal atrial fibrillation (PAF) patients[1].Irrigated force sensing ablation catheters (AC) have improved efficacy of the ablation procedure while minimizing complications like thrombus formation and stroke[2].Irrigated-tip ACs by virtue of their design infuse large volumes of heparinized saline in short time periods, especially during lesion formation which can be substantial in long atrial fibrillation (AF) ablation procedures[2]. However, the clinical impact of these large saline infusions in immediate post-operative period is not well studied.
Currently, there are two force-sensing irrigated-tip ACs available from Biosense Webster, which are FDA approved for ablation treatment in patients with PAF. These are the SmartTouch ThermoCool® ablation catheter (TCAC) and the SmartTouch ThermoCool® ‘Surround Flow’ irrigated-tip ablation catheter (SFAC)[3]. Although similar in mechanical design, these ACs have different irrigation flow rates of heparinized saline. The base flow-rate when not ablating is the same at 2 ml/min for both the ACs. However, when utilizing radiofrequency (RF) energy of ≤30 watts, the flow rates are 17 ml/min and 8 ml/min, respectively. With >30 watts of RF energy the flow rates increase to 30 ml/min and 15 ml/min, respectively. During long radiofrequency ablation (RFA) procedures the difference in the infused saline can be substantial between these two ACs.
We took advantage of the differential flow rates between these otherwise similar designed ACs to evaluate the measurable biochemical and clinical impact of the saline volume infused through the ACs in PAF patients during their RFA procedure in the immediate post operative period of up to 1 month.
Study Population and Design
This was a retrospective, single center chart review study. Deidentified electronic medical records of consecutive patients aged between 18 and 81 years who had undergone a RFA procedure for the indication of PAF at OhioHealth Riverside Methodist Hospital, Columbus, Ohio, USA, from May 1, 2017 to June 1, 2018 were retrospectively reviewed. We included both first time and repeat RFA patients who had symptomatic PAF with or without anti-arrhythmic medication use. The study was approved by OhioHealth Institutional Review Board. Electro-anatomic mapping with CARTO 3 system (Biosense Webster, Diamond Bar, CA) was used to perform wide antral contiguous ablations (WACA) around pulmonary vein in all patients to achieve PVI using RF energy. In selected patients cavo-tricuspid isthmus (CTI) ablation, and/or left atrial roof or mitral isthmus line ablations were also performed as clinically indicated using either TCAC or SFAC under general anesthesia. The use of TCAC or SFAC was solely based on the operator preference and was roughly 1:1 in the data reviewed.
The patient demographics, medication and medical history, RFA procedure details, pre and post-RFA parameters as shown in [Table 1] were systematically reviewed.
Table 1. Clinical variables Reviewed for the Research Study for all Patients
| Category |
Parameters |
| Demographics,Medications and Medical History |
1. Age |
|
2. Gender |
|
3. Medications |
|
a. Beta blocker |
|
b. Calcium channel blocker |
|
c. ACE inhibitor |
|
3. Medications |
|
d. Anti-arrhythmic medication |
|
e. Anticoagulation medication |
|
4. Medical history |
|
a. Hypertension |
|
b. Diabetes |
|
c. CVA |
|
d. Vascular disease (PVD or CAD) |
| Pre-RFA Procedure |
1. Left ventricular ejection fraction (LVEF; %) |
|
2. Left atrial size (cm) |
|
3. QTc on pre-RFA ECG (msec) |
|
4. Weight (kg) |
|
a. Serum creatinine (mg/dL) |
|
b. Serum electrolytes (Na, K and Mg, Cl, HCO3, Anion Gap; mEq/L, Ca; mg/dl) |
| RFA Procedure |
1. Type of ablation catheter used (TCAC or SFAC) |
|
2.Type of ablations performed |
|
a. Wide-area circumferential ablation around PVs |
|
b. Cavo-tricuspid isthmus ablation |
|
c. Additional RFA lines (LA roof/floor or mitral isthmus) |
|
3.Fluid via ablation catheter (ml) |
|
4. Fluid via non-ablation catheter sources (ml) |
|
5.Use of Furosemide post-RFA |
|
6.Total procedure time (groin access to sheath pull; min) |
|
7. Fluoroscopy time (min) |
|
8. Total number of RFA lesions (number) |
|
9. RFA total time (min) |
|
10. Foley catheter insertion (yes/no) |
|
11. Urine production at end of RFA(ml) |
|
12. External Cardioversion during RFA |
|
13. Cardiac rhythm at the start of the procedure |
| Post-RFA Procedure |
1. Length of stay in the hospital (hours) |
|
2. Use of Furosemide through 30 days post-RFA |
|
3. Foley catheter in situ time (min) |
|
4. Urine production (ml/hr) during hospital stay while Foley in place |
|
5. Weight post-RFA (kg) |
|
6. QTc on post-RFA ECG |
|
7. Chemistry panel |
|
a. Serum creatinine (mg/dL) |
|
b. Serum electrolytes (Na, K, Mg, Cl, HCO3, Anion Gap; mEq/L, Ca; mg/dl) |
|
8. Readmission to the hospital or phone calls within 30 days with RFA-related complications |
|
9. External Cardioversion post-RFA for recurrent AF |
ACE: angiotensin converting enzyme; CVA: Cerebrovascular accident; PVD: Peripheral vascular disease; CAD: coronary artery disease; LVEF: Left ventricular ejection fraction; TCAC: SmartTouch ThermoCool® ablation catheter; SFAC: SmartTouch ThermoCool® ‘Surround Flow’ irrigated-tip ablation catheter; PVs: Pulmonary veins; LA: Left atrium; RFA: Radiofrequency ablation; AF: Atrial fibrillation
Pre-procedure QTc, serum electrolytes and creatinine, LVEF% (using surface echocardiography or intra-cardiac echocardiography) and left atrial (LA) dimensions (using CT Angiogram, or surface/intra-cardiac echocardiography) were collected within 30 days prior to or on the day of RFA procedure. TEE if indicated was performed immediately prior to RFA. Accurate body weight and BMI was collected on the morning prior to the RFA procedure.
Post procedure QTc, serum electrolytes, serum creatinine and body weights were recorded within 24 hours of the RFA. Intravenous furosemide in increments of 20 mg was used on the operator’s discretion either immediately post RFA or the next day based on the urine output and/or weight gain. Post ablation follow up was performed by review of electronic medical record (EMR) and face to face evaluation depending on physician preference.
For continuous variables, means and standard deviations were computed and for categorical variables, proportions and frequency counts were calculated. Group comparisons of categorical variables were made using Fisher’s exact or Chi square test and continuous variables using Student’s t-test (for normally distributed variables) and Mann-Whitney U test (for variables not distributed normally). Paired continuous variables pre and post intervention were compared with either paired t-test or Wilcoxon signed rank test for normally or not normally distributed data, respectively. A statistical test was considered significant if the P value was <0.05.
The Pearson correlation coefficient (r) was used to measure the strength of a linear association between two variables. A value of r -1.0 to -0.5 or 1.0 to 0.5 was considered strong correlation; -0.5 to -0.3 or 0.3 to 0.5 was moderate correlation; -0.3 to -0.1 or 0.1 to 0.3 was weak correlation and -0.1 to 0.1 was none or very weak correlation. A statistical test was considered significant if the P value was <0.05.
We used SAS enterprise 7.1 (Cary, NC) for statistical analysis of the data.
Forty seven consecutive patients undergoing PAF ablations were retrospectively reviewed. Twenty three of them underwent PAF ablation with a TCAC and the remaining 24 with a SFAC.
Patient baseline characteristics as noted under the demographics, medication and medical history section in [Table 1] were not significantly different between the 2 groups. The overall patient population was of lower acuity with LVEF of 57.8±7%, LA size of 44.2±7.5 mm and CHADS VASC score of 2.4±1.4, and these parameters were not significantly different between the 2 groups studied.
Fluid infused during RFA procedure
The mean volume of heparinized saline infused through the AC in the patients was significantly higher when TCAC was used when compared to the SFAC (1277±316 vs 697±299ml; p<0.001). Consequently, the mean total volume of fluid given during the AF ablation procedure to these patients was also significantly higher when TCAC was used (3105±803 vs 2288±726ml; p<0.001). However, the mean saline volume infused from other sources besides the AC between the 2 groups was not statistically different. Furthermore, the total procedure time and total RFA time were also not significantly different between the 2 groups [Table 3].
This suggests that the observed differences in the clinical/biochemical parameters as noted below may be directly correlated with the saline volume infused via the RF AC during the AF ablation procedure.
We evaluated serum chemistries and found a significant reduction of serum creatinine, calcium, magnesium and bicarbonate, along with significant increase in serum chloride but no change in serum sodium across all patients irrespective of the AC used [Table 2].
Table 2. Comparison of clinical variables pre and post-RFA procedure for AF ablation utilizing TCAC and SFAC
| Study Variable |
|
Pre-RFA |
Post-RFA |
Post-Pre RFA Difference |
p-value |
| Thermocool AC (TCAC; n=23) |
| Weight, (Kg) |
Mean (SD |
96.0 (23.3) |
97.5 (23.8) |
1.46 (2) |
0.002a |
|
Median (IQR) |
88.8 (107.3, 82.7) |
88.8 (107.8, 83.1) |
1.5 (2.7, 0.5) |
|
| Sr. Creatinine,(mg/dl) |
Mean (SD |
0.93 (0.18) |
0.8 (0.2) |
-0.14 (0.13) |
<0.001a |
|
Median (IQR) |
0.89 (1.1, 0.77) |
0.7 (0.93, 0.67) |
-0.14 (-0.02, -0.24) |
|
| Sr. Sodium, (meq/l)
|
Mean (SD |
140.9 (2.3) |
139.8 (2.1) |
-1.13 (2.7) |
0.056a |
|
Median (IQR) |
141 (142, 139) |
140 (140, 138) |
-1 (0, -3) |
|
| Sr. Potassium,(meq/l) |
Mean (SD |
4.4 (0.42) |
4 (0.32) |
-0.44 (0.43) |
<0.001b |
|
Median (IQR) |
4.5 (4.6, 4.1) |
4.1 (4.2, 3.8) |
-0.3 (-0.2, -0.7) |
|
| Sr. Magnesium,(meq/l)
|
Mean (SD |
2.1 (0.16) |
1.97 (0.2) |
-0.14 (0.22) |
0.04a |
|
Median (IQR) |
2.1 (2.2, 2) |
2 (2.1, 1.8) |
-0.1 (0, -0.3) |
|
| Sr. Chloride,(meq/l) |
Mean (SD |
101.9 (2.6) |
104.0 (3.13) |
2.1 (2.8) |
0.001a |
|
Median (IQR) |
102 (103, 100) |
104 (106, 101) |
3 (4, -1) |
|
| Sr. Bicarbonate,(meq/l)
|
Mean (SD |
25.4 (1.6) |
23.96 (2.2) |
-1.43 (2.3) |
0.01b |
|
Median (IQR) |
25 (27, 25) |
23 (26, 22) |
-2 (0, -4) |
|
| Anion gap,(meq/l)
|
Mean (SD |
18.5 (1.6) |
15.7 (2.1) |
-2.7 (2.3) |
<0.001a |
|
Median (IQR) |
18 (20, 18) |
16 (17, 14) |
-3 (-1, -4) |
|
| Sr. Calcium,(mg/dl)
|
Mean (SD |
9.3 (0.4) |
8.3 (0.37) |
-1.0 (0.45) |
<0.001a |
|
Median (IQR) |
9.3 (9.7, 9.0) |
8.3 (8.6, 8.1) |
-1.1 (-0.6, -1.3) |
|
| QTc, (msec) |
Mean (SD |
435.8 (26.3) |
452.6 (28.8) |
18.5 (27.2) |
0.004a |
|
Median (IQR) |
435 (461, 414) |
460 (472, 440) |
15 (41, 3) |
|
| Surround Flow AC (SFAC) |
| Weight, (Kg) |
Mean (SD |
103.4 (28.9) |
103.5 (29.4) |
0.32 (1.7) |
0.38a |
|
Median (IQR) |
106.4 (119.1, 82.5) |
105.8(119.7, 83) |
0 (2, -1) |
|
| Sr. Creatinine,(mg/dl) |
Mean (SD |
0.96 (0.16) |
0.87 (0.19) |
-0.1 (0.15) |
0.003a |
|
Median (IQR) |
0.94 (1.1, 0.9) |
0.81 (1.05, 0.74) |
-0.1 (-0.02, -0.21) |
|
| Sr. Sodium, (meq/l)
|
Mean (SD |
140.5 (2.6) |
139.3 (2.8) |
-0.8 (1.8) |
0.052b |
|
Median (IQR) |
141 (142, 139) |
140 (141, 138) |
-1 (1, -3) |
|
| Sr. Potassium,(meq/l) |
Mean (SD |
4.4 (0.3) |
4.2 (0.4) |
-0.16 (0.5) |
0.16a |
|
Median (IQR) |
4.4 (4.6, 4.2) |
4.1 (4.5, 3.9) |
-0.2 (0.3, -0.5) |
|
| Sr. Magnesium,(meq/l)
|
Mean (SD |
2.0 (0.13) |
1.9 (0.12) |
-0.09 (0.17) |
0.04a |
|
Median (IQR) |
2 (2.1, 1.9) |
1.9 (2, 1.8) |
-0.1 (0.05, -0.15) |
|
| Sr. Chloride,(meq/l) |
Mean (SD |
100.9 (1.8) |
103.4 (2.9) |
2.5 (2.4) |
<0.001b |
|
Median (IQR) |
101 (102, 100) |
103 (105, 102) |
1 (4, 1) |
|
| Sr. Bicarbonate,(meq/l)
|
Mean (SD |
26.1 (2.3) |
23.9 (1.8) |
-2.2 (2.6) |
<0.01b |
|
Median (IQR) |
27 (28, 25) |
24 (25, 23) |
-3 (-1, -4) |
|
| Anion gap,(meq/l)
|
Mean (SD |
17.8 (2.8) |
16.3 (1.9) |
-1 (2.4) |
0.06a |
|
Median (IQR) |
18 (19, 16) |
17 (17, 15) |
-1 (1, -4) |
|
| Sr. Calcium,(mg/dl)
|
Mean (SD |
9.4 (0.46) |
8.5 (0.6) |
-0.9 (0.62) |
<0.001a |
|
Median (IQR) |
9.5 (9.9, 9.1) |
8.6 (8.9, 8.1) |
-0.9 (-0.3, -1.3) |
|
| QTc, (msec) |
Mean (SD |
440.7 (20.8) |
455.5 (31.3) |
15.7 (23.2) |
0.005a |
|
Median (IQR) |
442.5 (453, 422) |
455 (469, 430) |
13.5 (31, 1) |
|
RFA: Radiofrequency ablation AC: Ablation catheter; SD= Standard deviation; IQR= Interquartile range; Sr. = Serum; a= Paired t-test; b= Wilcoxon signed rank test
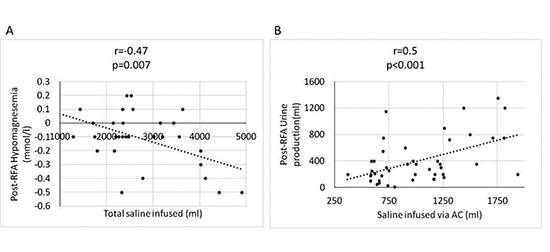
When these serum chemistry changes were correlated with the saline volume infused during RFA we found that post-RFA potassium reduction (r=-0.34; p=0.01), and post-RFA magnesium reduction (r=-0.47; p=0.007; [Figure 2], panel A) were the only two parameters moderately correlated with total fluid infused during the RFA procedure.
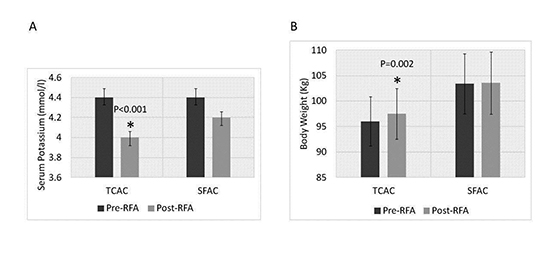
Significant post-RFA reduction in serum potassium level ([Figure 1], panel A) was noted only when using higher saline volume infusing TCAC (4.4±0.42 vs 4±0.32 mmol/l; p<0.001) and not with SFAC use (4.4±0.3 vs 4.2±0.4 mmol/l; p=0.16). This finding is independent of furosemide use and was demonstrated uniformly in all patients undergoing ablation with TCAC. In fact, post-RFA potassium reduction in TCAC group who did not receive furosemide was also significant (4.6±0.49 vs 4±0.39 mmol/l; p=0.001).
Figure 1. Post-RFA change in serum potassium and body weight related to the type of AC used. Panel A: Bar graph depicting mean serum potassium levels pre and post-RFA with use of high and low saline volume infusing TCAC and SFAC, respectively. Significant post-RFA potassium reduction was only observed with HSVI TCAC. Panel B: Bar graph depicting mean body weight pre and post-RFA with use of high and low volume infusing TCAC and SFAC, respectively. Significant post-RFA weight gain was only observed with HSVI TCAC. Error bars depict SEM.
Clinical parameters that can be affected with differential saline volume infusion via the AC or associated serum electrolytes disturbances were also evaluated.
Post-RFA weight gain was significantly higher when TCAC was used (96±23 vs 97.5±24 kg; p=0.002) when compared to SFAC (103.4±29 vs 103.5±29 kg; p=0.38) ([Figure 1], panel B). Furthermore, post-RFA rate of urine production (120±79 vs 63±31ml/hr; p=0.003) and use of loop diuretic, furosemide (39% vs 0%; p=0.0006) were also significantly higher with TCAC use [Table 3].
In TCAC group, 5 patients received furosemide 20 mg intravenously immediately post-RFA and the rest 4 patients received it on post-RFA day #1 before discharge. Importantly, the first group did not have significant weight-gain (94.7±11 vs 95.4±11 kg; p=0.5). Post-RFA weight gain was only moderately correlated with fluid through the AC and total fluid infused (r=0.3; p=0.03 and r=0.34; p=0.02 respectively)
We found that the higher urine production in the TCAC group was not exclusively related to furosemide usage, since patients who did not receive furosemide post-RFA in the TCAC group also had significantly higher urine production when compared to SFAC group (1132±621 vs 693±421 ml; p=0.01). Post RFA urine production was moderate to strongly correlated with the volume of saline infused via AC (r=0.5; p<0.001; [Figure 2], panel B).
QTc intervals were also significantly increased post-RFA irrespective of the AC used although still within normal limits (Table 2). The modest post-RFA QTc prolongation was not correlated with fluid administered, but as expected, moderately correlated with induced post-RFA magnesium reduction (r=0.34; p=0.07).
Figure 2. Post-RFA hypomagnesaemia and urine production related to fluid infused during RFA procedure. Panel A: Scatter plot depicting a moderate to strong negative correlation (r=-0.47; p=0.007) between the total fluid infused during RFA (x axis) and the observed post-RFA reduction in serum magnesium levels (y axis) among all patients undergoing AF ablation procedure using either TCAC or the SFAC. Panel B: Scatter plot depicting a moderate to strong positive correlation (r=0.5; pLT;0.001) between the fluid infused via the ablation catheter (x axis) and the post-RFA urine production (y axis) among all patients undergoing AF ablation procedure using either TCAC or the SFAC.
Post-RFA morbidity and other Clinical Parameters
Surprisingly, the higher saline infusion and weight gain noted with TCAC did not translate into higher readmission rates due to fluid overload among these patients in the immediate post-RFA period up to 1 month. We did not find any increase in intra/post-procedure external cardioversions for AF, phone calls post-RFA procedure [Table 3],
ventricular arrhythmias from QTc prolongation or signs or symptoms of tetany from hypocalcemia.
Between the TCAC and SFAC groups we also did not note any significant difference in average procedural characteristics including fluoroscopy time, number of RFA lesions made during the procedure, ablation lesion set of PVI, CTI, LA roof or mitral isthmus lines performed during the procedure, average patient length of stay in the hospital, in-situ Foley catheter time[Table 3] or related complications like hematuria.
Table 3. : Comparison of clinical variables between the two groups of PAF patients who underwent AF ablation using TCAC and SFAC
| Study Variable |
|
Thermocool AC |
Surround Flow AC |
p-value |
|
|
TCAC (n=23) |
SFAC (n=24) |
|
| Urine output (ml) at procedure end |
Mean (SD |
500.7 (372.2) |
295.7 (287.3) |
0.02b |
|
Median (IQR) |
350 (750, 200) |
200 (400, 100) |
|
| Rate of urine production (ml/hr) |
Mean (SD |
119.9 (79.3) |
63.1 (31.3) |
0.003a |
|
Median (IQR) |
96.8 (154.5, 58.3) |
58.3 (87.9, 41.7) |
|
| Fluid via AC, (ml) |
Mean (SD |
1277 (315.8) |
697.3 (299.3) |
<0.001b |
|
Median (IQR) |
1229 (1498, 1000) |
650 (731, 584) |
|
| Ex-AC fluid, (ml) |
Mean (SD |
1828 (689) |
1591 (583.6) |
0.21a |
|
Median (IQR) |
1800 (2250, 1117) |
1637.5 (1998, 1108) |
|
| Total fluid, (ml)
|
Mean (SD |
3105 (803) |
2288.8 (725.8) |
<0.001a |
|
Median (IQR) |
3022 (3557, 2471) |
2330 (2775, 1723) |
|
| Procedure time,(min)
|
Mean (SD) |
213.9 (43.5) |
192.7 (46.0) |
0.11b |
|
Median (IQR) |
210 (240, 195) |
201.5 (217, 137) |
|
| Fluoroscopy time, (sec) |
Mean (SD) |
523.6 (277.4) |
511.8 (231.8) |
0.39a |
|
Median (IQR) |
447 (654, 384) |
496.0 (620.5, 344.5) |
|
| No. of RFA lesions, |
Mean (SD) |
117.7 (44) |
108.8 (40) |
0.19b |
|
Median (IQR) |
121 (131, 100) |
112.5 (122.5, 96) |
|
| Length of stay,(hr)
|
Mean (SD |
30.7 (18.0) |
30.8 (13.2) |
0.37b |
|
Median (IQR) |
10 (12, 8.5) |
9.7 (12, 9.3) |
|
| WACA for PVI, N (%) |
Yes |
20 (83.3) |
21 (91.3) |
0.4c |
|
Redo |
4 (16.7) |
2 (8.7) |
|
| CTI line, N (%) |
No |
5 (20.8) |
3 (13.0) |
|
|
yes |
19 (79.2) |
19 (82.6) |
0.5c |
|
Redo |
0 |
1 (4.4) |
|
| LA floor line, N (%) |
yes |
0 |
1 (4.2) |
0.99c |
|
No |
23 |
23 (95.8) |
|
| LA roofline, N (%) |
yes |
6 (26.1) |
4 (16.7) |
0.4c |
|
No |
17 (73.9) |
20 (83.3) |
|
| Mitral isthmus line, N (%) |
yes |
1 (4.4) |
1 (4.2) |
0.98c |
|
No |
22 (95.7) |
23 (95.8) |
|
| Post-RFA Furosemide use, N (%) |
yes |
9 (39.1) |
0 |
<0.001c |
|
No |
14 (60.9) |
24 |
|
| Re-admission, N (%) |
yes |
1 (4.3) |
1 (4.2) |
0.09c |
|
No |
22 (95.7) |
23 (95.8) |
|
| Post-discharge phone calls, N (%) |
yes |
8 (34.8) |
6 (25) |
0.4c |
|
No |
15 (65.2) |
18 (75) |
|
| Post-discharge phone calls, N (%) |
yes |
9 (39.1) |
9 (37.5) |
0.91c |
|
No |
14 (60.9) |
15 (62.5) |
|
AC: ablation catheter; Ex-AC: sources other than AC; RFA: radiofrequency ablation; WACA: Wide-area circumferential ablation; PVI: pulmonary vein isolation; CTI: cavotricuspid isthmus; LA: left atrium; SD= Standard deviation; IQR= Interquartile range; a= Two sample t-test; b= Wilcoxon Mann-Whitney U test; c= Chi square- test
Our study highlights important findings which will be relevant for clinicians who perform RF ablations for treatment of PAF. First, use of higher saline volume infusing (HSVI) AC is more likely to cause post-RFA weight gain despite more frequent post-RFA use of loop diuretics, leading to increased urine production and associated post-RFA potassium reduction. Second, when using HSVI AC, immediate post-RFA furosemide usage seems to prevent this weight gain. Third, all patients undergoing PAF ablation with an irrigated-tip AC exhibit significant serum electrolyte disturbances like post-RFA magnesium and calcium reduction with associated QTc prolongation although still within normal limits, and hyperchloremic metabolic acidosis and post-RFA creatinine reduction. Fourth, in our experience the observed biochemical and clinical changes do not translate into increase in post-procedure morbidity in lower acuity PAF patients.
Huang et al, in a larger cohort of 111 patients have previously reported prolonged hospital admission and readmission rates after AF ablation at 5.4 and 7.2%, respectively[4] .This was primarily observed in older patients with persistent AF, who presented in AF at the start of the procedure and had longer procedure time with more ablation lesions[4]. Nonetheless, even in their higher acuity patient population they also did not find the use of HSVI AC to be significantly associated with fluid overload readmissions after RFA[4].
We find an average post-RFA weight increase in the TCAC group of 1.5 kg but virtually none in the SFAC group despite only an average of ~800 ml higher saline intake in the former group. The exact cause for this would be difficult to determine from this retrospective study but a number of reasons can potentially explain this observation: a) A ‘threshold affect’ suggesting that the TCAC group got higher saline infusion during the procedure than aputative threshold amount that the human body can efficiently equilibrate in a timely fashion, b) A higher oral intake in the TCAC group cannot be completely ruled out since this was not monitored in this retrospective study, c) It is also possible that the TCAC group that gained more weight were more dehydrated pre-RFA than the SFAC group. Our patient cohort had normal cardiac and kidney functions, which coupled with significantly higher furosemide use and higher urine production when using HSVI AC likely prevented sustained fluid overload, thus preventing readmissions despite significant immediate post-RFA weight gain.
Significant post-RFA potassium reduction observed only with HSVI AC use is primarily due to increase in the delivery of Na+ and H2O in the distal nephron from larger saline infusion stimulating K+ secretion by lowering luminal K+ concentration and making the luminal potential more negative. Associated post-RFA magnesium reduction and more frequent furosemide usage in TCAC cohort also contributed to post-RFA potassium reduction albeit only to a lesser extent. This suggests that infusion of larger amounts of normal saline during PAF ablations inherently predisposes patients to post-RFA potassium reduction.
Rapid large-volume isotonic saline infusion without alkali caused hyperchloremic metabolic acidosis noted in all our patients irrespective of the irrigated-tip AC used. The underlying cause is dilution of the preexisting serum bicarbonate and increase in renal bicarbonate elimination as a result of chloride excess from volume expansion[5]. Although not tested here, conceptually, using normal saline with sodium bicarbonate in the ablation fluid should reduce the occurrence of post-RFA hyperchloremic metabolic acidosis and potentially other related biochemical changes.
Observed post-RFA calcium reduction has been previously described and is thought to be due to impaired renal Ca2+ re-absorption and perhaps dilutional in nature,[6] akin to trauma patients after fluid resuscitation[7]. No evidence of clinical tetany was observed in our patients, probably due to unchanged ionized serum Ca2+. Furthermore, observed metabolic acidosis is protective against clinical tetany.
We noted significant post-RFA magnesium reduction with both the ACs. Besides being dilutional in nature, associated metabolic acidosis and post-RFA potassium reduction will also cause post-RFA magnesium reduction. Furthermore, furosemide use in the TCAC group reduced magnesium resorption in the ‘loop of Henle’ increasing its excretion via the kidneys.
In light of these biochemical changes and possibly autonomic nervous system modulation with ganglionic plexus ablation when ablating around the PVs, it is not surprising to see a significant but modest increase in post-procedure QTc interval (although still within normal limits) which has also been previously reported in AF ablation patients[8]. In our cohort this is noted in all patients irrespective of the volume of saline infused through the AC. Observed QTc prolongation did not increase the incidence of torsade de pointe.
Ours is a retrospective, single tertiary care center observational study with a relatively small number of lower acuity PAF patients and therefore may not be generalizable to other patient populations.
It is possible that due to a small clinical affect we do not see a significant increase in fluid overload readmissions when using HSVIAC in the number of patients that we have studied. However with a larger number or higher acuity (systolic heart failure or chronic renal disease) patients this may become clinically significant. Further studies are needed to confirm this potential outcome.
We did not study proprietary irrigated-tip ACs from other manufacturers besides Biosense Webster. However, we see no scientific reason that these results would not be generalizable to their use. We think that these results are more specific to the saline volumes infused via irrigated-tip ACs during ablations for treatment of PAF irrespective of the AC manufacturer.
Use of higher saline-volume infusing AC in PAF ablations causes significant post-ablation weight-gain despite frequent furosemide use, larger urine production and associated significant post-RFA potassium reduction without increasing morbidity in lower acuity patients.


