Predictors of Acute Atrial Fibrillation and Flutter Hospitalization across 7 U.S. Emergency Departments: A Prospective Study
Bory Kea1, E. Margaret Warton2, Dustin W. Ballard234, Dustin G. Mark35, Mary E. Reed2, Adina S. Rauchwerger2, Steven R. Offerman36, Uli K. Chettipally37, Patricia C Ramos8, Daphne D. Le9, David S. Glaser10, David R. Vinson2311
1Center for Policy and Research in Emergency Medicine, Department of Emergency Medicine, Oregon Health and Science University, Portland, Oregon.2Kaiser Permanente Northern California Division of Research, Oakland, California.3The Permanente Medical Group, Oakland, California.4Kaiser Permanente San Rafael Medical Center, San Rafael, California.5Kaiser Permanente Oakland Medical Center, Oakland, California.6Kaiser Permanente South Sacramento Medical Center, Sacramento, California.7Kaiser Permanente South San Francisco Medical Center, South San Francisco, California.1SUNY Upstate Medical University.8Kaiser Permanente Sunnyside Medical Center, Northwest Permanente Physicians and Surgeons, Department of Emergency Medicine, Portland, Oregon.9University of California, Berkeley, California.10Sisters of Charity of Leavenworth St. Joseph Hospital, Department of Emergency Medicine, Denver, Colorado.11Kaiser Permanente Sacramento Medical Center, Sacramento, California.
International rates of hospitalization for atrial fibrillation and flutter (AFF) from the emergency department (ED) vary widely without clear evidence to guide the identification of high-risk patients requiring inpatient management. We sought to determine (1) variation in hospital admission and (2) modifiable factors associated with hospitalization of AFF patients within a U.S. integrated health system.
This multicenter prospective observational study of health plan members with symptomatic AFF was conducted using convenience sampling in 7 urban community EDs from 05/2011 to 08/2012. Prospective data collection included presenting symptoms, characteristics of atrial dysrhythmia, ED physician impression of hemodynamic instability, comorbid diagnoses, ED management, and ED discharge rhythm. All centers had full-time on-call cardiology consultation available. Additional variables were extracted from the electronic health record. We identified factors associated with hospitalization and included predictors in a multivariate Poisson Generalized Estimating Equations regression model to estimate adjusted relative risks while accounting for clustering by physician.
Among 1,942 eligible AFF patients, 1,074 (55.3%) were discharged home and 868 (44.7%) were hospitalized. Hospitalization rates ranged from 37.4% to 60.4% across medical centers. After adjustment, modifiable factors associated with increased hospital admission from the ED included non-sinus rhythm at ED discharge, no attempted cardioversion, and heart rate reduction.
Within an integrated health system, we found significant variation in AFF hospitalization rates and identified several modifiable factors associated with hospital admission. Standardizing treatment goals that specifically address best practices for ED rate reduction and rhythm control may reduce hospitalizations.
Key Words : atrial fibrillation, atrial flutter, predictors of hospitalization, hospitalizationvariation, heart rate, electric cardioversion, emergency medicine, arrhythmia, , arrhythmiacardioversion.
Bory Kea, MD
3181 SW Sam Jackson Park Rd, MC CR 114
Portland, OR 97239
Atrial fibrillation (AF) and flutter (AFL) (combined: AFF) impair quality of life, heighten the risk of ischemic stroke, and complicate the course of congestive heart failure.[1]-[5] These age-related atrial dysrhythmias are growing in prevalence with the aging of the U.S. population and the increasing prevalence of chronic heart disease.[6] In the coming years, the substantial public health and economic burden associated with AFF will only rise. Driven primarily by hospitalizations, the annual health care costs exceed $6 billion in the U.S.,[7] and have continued to increase for this population.
While AFF is the same disease globally, hospitalization rates of emergency department (ED) patients with AFF vary dramatically between countries, ranging from approximately 25% in the U.K. to nearly 70% in the U.S. with geographical variations.[8] Even within countries, inter-facility hospitalization can vary widely, ranging from 3% to 97% within one Canadian province.[9] The degree to which physician experience, medical treatments, and ED factors contribute to the variation in AFF hospitalization is poorly understood.[9], [10] A study by Lin et al. found that one-fifth of variation in U.S. hospitalizations from 2006-2011 was due to the hospital site and not hospital characteristics, suggesting that institution-specific practice culture contributes significantly to variance in ED hospitalization for AF.[11] Further contributing to the variation in hospitalization is the lack of international multidisciplinary consensus guidelines for AFF care for ED providers to call upon.[12]-[14] Several studies have developed scoring tools to risk-stratify patients to identify who would benefit from admission, including TrOPs-BAC (Troponin, Other acute ED diagnosis, Pulmonary disease, Bleeding risk, Age> 75yo and evidence of Cardiac failure) and RED-AF (Risk Estimator Decision aid for Atrial Fibrillation) risk stratification scoring systems.[15], [16] However, no single risk stratification instrument has been widely adopted by emergency providers.
Given the variation in AFF hospitalization and the need to better identify modifiable management factors, we undertook a multicenter, prospective observational study within an integrated healthcare system in the western U.S. to evaluate AFF hospitalization practice patterns. We expected that patient-level factors leading to variations in AFF hospitalization rates would be more evident within a single system. We also examined hospital- and physician-level predictors of hospitalization. As follow-up care is more easily coordinated within an integrated care system, thereby facilitating home discharge from the ED, we hypothesized that hospitalization would be lower than the U.S. western average (57%) in this setting and would primarily vary at the patient-level by patient case-mix,[8] with hospitalization associated with higher acuity patients and failure to achieve rate and rhythm control more than with physician or hospital variables.
Study Design, Setting, and Population
This analysis was part of a larger prospective multicenter observational study, TAFFY (Treatment of AFF in emergencY medicine) conducted in 7 Kaiser Permanente Northern California (KPNC) urban community EDs between May 2011 and August 2012.[2] These urban community EDs are part of a large integrated healthcare system providing comprehensive medical care to health plan members who are highly representative of the demographic diversity of the surrounding and statewide population and represent approximately 33% of the population in areas served.[17]
Study hospitals are non-rural urban community hospitals with a trauma designation at the time of Level III or less. Annual census ranged from 25,000 to 85,000, and inpatient bed capacity ranged from 116 to 340. Several medical centers were affiliated teaching facilities for emergency medicine (n=3) and internal medicine residency training programs (n=2), and one was a primary teaching facility for internal medicine. All hospitals allowed short-term (<24 hours) inpatient observational status. Three had an outpatient short-term clinical decision area, two of which were managed by hospitalists and one by emergency physicians. All 7 medical centers had an intensive care unit that provided cardiac care, and on-call cardiology was available to the ED around the clock. Each medical center in the system uses a comprehensive, integrated electronic health record (EHR; Epic, Verona, WI), which includes inpatient, outpatient, emergency, pharmacy, laboratory, and imaging data.[18] Additionally, all centers had around-the-clock pharmacy services available for the dispensing of medications on site and the involvement of a pharmacy-led, telephone-based anticoagulation service for close follow-up and serial monitoring.[19]
Hospitalization decisions were made by residency-trained and board-certified (or board-prepared) emergency medicine and hospitalist faculty (not residents). No policies were in place at the participating medical centers during the study period to govern the hospitalization decision-making or overall management of patients with AFF. Patient care was left entirely to the discretion of the treating physicians.[2]
Prospective study enrollment was undertaken via convenience sampling by treating ED physicians using either a two-page paper sheet or an electronic template.[20] Adult (≥18 years) KPNC health plan members in the ED with electrocardiographically-confirmed nonvalvular AFF were eligible for enrollment if their atrial dysrhythmia was either symptomatic (including newly diagnosed) or treated in the ED. Patients were ineligible for the study if they transferred in from another ED, were receiving palliative-only comfort care, had an implanted cardiac pacemaker/defibrillator, or had just been resuscitated from cardiac arrest. For this analysis, those discharged to another facility outside of the healthcare system were excluded to assure complete capture of the outcome. This practice was uncommon in this setting.
To assess for selection bias, we undertook monthly manual chart review audits at each medical center to identify cases that were TAFFY eligible but had not been enrolled. We compared the enrolled population with the missed eligible population to assess for selection bias. Physician abstractors were trained on data collection by the principal investigator, who also answered questions and arbitrated coding questions until consensus was achieved. Although we collected prospective data on each eligible ED AFF episode, only a patient’s first enrollment was included in this analysis.
The study was approved by the KPNC Institutional Review Board. Waiver of informed consent was obtained due to the observational nature of the study.
Variables collected prospectively included presenting symptoms, characterization of the atrial dysrhythmia, ED provider impression of hemodynamic instability, comorbid diagnoses, ED management (e.g. intravenous rate reduction medications [calcium or beta blocker] or digoxin needed to manage rapid ventricular response, attempted cardioversion [pharmacologic and/or electrical], failed cardioversion attempt, failure of restoration of sinus rhythm in the ED, formal cardiology consultation), and ED discharge rhythm. At the time of ED enrollment, we identified other active conditions that may have triggered the AFF onset or exacerbation, including pulmonary processes, systemic infections, hypovolemia, toxins, and other potential triggers.[21]
Table 1. Demographics of emergency department patients with atrial fibrillation or flutter, stratified by hospitalization.
| Patient Characteristics |
Total,n=1,942 |
Hospitalized,n=868 (44.7%)* |
Discharge to Home,n=1,074 (55.3%)* |
P-value† |
| Age at ED Visit, years |
|
|
|
|
| Mean (SD) |
70.7 (13.8) |
74.3 (12.7) |
67.9 (14.0) |
<0.0001 |
| Categorical |
|
|
|
|
| < 45 |
72 (3.7) |
13 (1.5) |
59 (5.5) |
<0.0001 |
| 45-64 |
526 (27.1) |
183 (21.1) |
343 (31.9) |
|
| 65-74 |
493 (25.4) |
201 (23.2) |
292 (27.2) |
|
| ≥ 75 |
851 (43.8) |
471 (54.3) |
380 (35.4) |
|
| Female Sex |
985 (50.7) |
456 (52.5) |
529 (49.3) |
0.16 |
| Race |
|
|
|
<01 |
| Asian |
144 (7.4) |
76 (8.8) |
68 (6.3) |
|
| Black/African American |
161 (8.3) |
88 (10.1) |
73 (6.8) |
|
| White/European |
1,566 (80.6) |
675 (77.8) |
891 (83.0) |
|
| Other/Unknown |
71 (3.7) |
29 (3.3) |
42 (3.9) |
|
| Low Socioeconomic Statusa |
335 (17.3) |
172 (19.8) |
163 (15.2) |
<01 |
ED, emergency department;
Additional variables extracted from the EHR included demographics, stroke risk (ATRIA [Anticoagulation and Risk Factors in Atrial Fibrillation][22], [23] stroke risk score ≥7 and CHA2DS2-VASc[24] score ≥2]), bleeding risk (HAS-BLED [25] score ≥3), Charlson Comorbidity Index (CCI), acuity of presentation defined by the Emergency Severity Index for triage (resuscitative, emergent/urgent, or non-urgent),[26] heart rate greater than 100 at disposition, first systolic blood pressure, and abnormal cardiac markers (elevated troponin >99th percentile, elevated B-type natriuretic peptide >500 mg/dL). Given findings from a prior study, hospital site, time of ED evaluations (weekday/weekend of ED visit, early morning [00:01-7:59], working hours [8:00-17:00], and evening [17:00-24:00]) and ED length of stay (hours), were also included as possible predictors.[27] We also measured census tract-level socioeconomic status (SES) from census data, where residence in a tract with ≥20% of households in poverty or ≥25% or residents who did not graduate high school was categorized as low SES.
Table 2. Comorbidities and scores of emergency department patients with atrial fibrillation or flutter (AFF), stratified by hospitalization.
| Patient Characteristics |
Total, n=1,942 |
Hospitalized, n=868 (44.7%)* |
Discharge to Home, n=1,074 (55.3%)* |
P-value† |
| Comorbidities and Scores |
| History of AFF |
996 (51.3) |
397 (45.7) |
599 (55.8) |
<0.0001 |
| On Anticoagulation |
| No |
1,478 (76.1) |
656 (75.6) |
822 (76.5) |
0.62 |
| Yes |
464 (23.9) |
212 (24.4) |
252 (23.5) |
|
| Charlson Scorea |
| Mean (SD) |
1.8 (2.2) |
2.5 (2.4) |
1.3 (1.9) |
<0.0001 |
| Median (IQR) |
1 (0-3) |
2 (0-4) |
0 (0-2) |
|
| Categorical |
| 0 |
774 (39.9) |
229 (26.4) |
545 (50.7) |
|
| 1 |
347 (17.9) |
155 (17.9) |
192 (17.9) |
|
| 2 |
265 (13.7) |
130 (15.0) |
135 (12.6) |
<0.0001 |
| 3+ |
556 (28.6) |
354 (40.8) |
202 (18.8) |
|
| ATRIA Risk Score [28]-[30] |
| Mean (SD) |
8.3 (6.0) |
10.0 (5.9) |
6.8 (5.7) |
<0.0001 |
| Median (IQR) |
7.0 (3-12) |
11 (5-14) |
6 (2-11) |
|
| Categorical |
| 0-5 (Low) |
749 (38.6) |
233 (26.8) |
516 (48.0) |
|
| 6 (Medium) |
151 (7.8) |
53 (6.1) |
98 (9.1) |
<0.0001 |
| ≥7 (High) |
1,042 (53.7) |
582 (67.1) |
460 (42.8) |
|
| CHA2DS2-Vasc Risk Score [31] |
| Mean (SD) |
2.9 (1.7) |
3.4 (1.6) |
2.5 (1.7) |
<0.0001 |
| Median (IQR) |
3 (2-4) |
4 (2-4) |
2 (1-4) |
|
| Categorical |
| 0-1 (Low) |
459 (23.6) |
114 (13.13) |
345 (23.1) |
|
| 2-4 (Medium) |
1150 (59.2) |
551 (63.5) |
599 (55.8) |
|
| ≥5 (High) |
333 (17.2) |
203 (23.4) |
130 (12.1) |
|
| HAS-BLED Risk Score [32] |
| Mean (SD) |
2.1 (1.6) |
2.7 (1.5) |
1.6 (1.4) |
<0.0001 |
| Median (IQR) |
2 (1-3) |
3 (2-4) |
1 (1-2) |
|
| Categorical |
| 0-1 (Low) |
790 (40.7) |
207 (23.8) |
583 (54.3) |
<0.0001 |
| 2-3 (Medium) |
772 (39.7) |
404 (46.5) |
368 (34.3) |
|
| ≥3 (High) |
380 (19.6) |
257 (29.6) |
123 (11.5) |
|
| RED-AF Score [20] |
| Mean (SD) |
128.4 (36.8) |
133.2 (37.1) |
124.5 (36.1) |
<0.0001 |
| Median (IQR) |
126 (103-153) |
132 (108-159) |
124 (98-147) |
|
| TrOPs-BAC [18] |
| Mean (SD) |
2.1 (1.4) |
2.7 (1.4) |
1.5 (1.3) |
<0.0001 |
| Median (IQR) |
2 (1-3) |
3 (2-4) |
1 (0-2) |
|
ED, emergency department;
Additionally, we calculated two risk stratification scores as possible predictors of hospitalization. The TrOPs-BAC score is a simplified pragmatic instrument that predicts 30-day mortality for AF patients in the ED.[15] The RED-AF risk score predicts the absolute risk of 30-day adverse events following an ED evaluation.[16] Both scores were modified slightly to accommodate the collection of data from the EHR.
Two physicians reviewed all hospital admitting diagnoses from the EHR to determine if AFF was the primary reason for admission, or if admission was likely triggered by another process (BK, DRV). Consensus was achieved through discussion between the two physicians.
Provider and Hospital Characteristics
We extracted demographic and clinical variables from the health system’s databases on ED provider characteristics, including gender and years of experience using age as a proxy. Hospital factors extracted included total number of ED visits per year and the number of ED beds, teaching status, and specialty of residency teaching.
Our primary study outcome was hospital admission, including short-term admissions (<24hrs) to an observation unit or clinical decision area.
We compared characteristics between those hospitalized and not hospitalized using likelihood ratio exact chi-square tests for categorical variables and t-tests or Wilcoxon rank sum tests for continuous variables. We used ANOVA to identify significant differences in unadjusted hospitalization rates between medical centers, and we calculated the intraclass correlation coefficient to determine the strength of correlations due to nesting of patient under physician and physician under the medical center. As hospitalization was a relatively common outcome, we used a Poisson regression to estimate relative risks instead a logistic model to estimate odds ratios. A Generalized Estimating Equations (GEE) models was chosen to generate estimates of associations between potential predictors and hospitalization as we were interested in population-level estimates, not individual patient-level estimates. While the interclass correlation was low for clustering by facility and physician, we explored adjusting for clustering by including provider as a random effect in these models. The non-clustered and clustered model results were nearly identical, thus a random effects model is presented in this manuscript. Due to a large amount of crossover between facilities by ED physicians, adjusting for hospital clustering using hospital as a random effect in a GEE Poisson mixed model was not possible (models didn't converge). Therefore, we included hospital as a fixed effect in the final models to examine differences in hospital admission rates after adjusting for patient characteristics. We reviewed QIC and QICu statistics to determine which independent variables to include in our final parsimonious model after reviewing associations between independent variables and the outcome in univariate models.
Thus, a Generalized Estimating Equations Poisson model estimating relative risks of hospitalization was selected with provider as a random effect and medical center as a fixed effect as our final model. Due to the co-linearity of stroke risk (ATRIA[22], [23], [28] and CHA2DS2-VASc[24]) and bleeding risk (HAS-BLED[25]) stratification scores, only ATRIA was included in the final model.
To further understand the difference in relative risk among patients with and without cardioversion and with failed vs successful cardioversion, we calculated the linear combinations of symptom group coefficients to generate estimates of hospitalization. All analyses were conducted using SAS statistical software, version 9.4 (Cary, N.C.).
During the study period, 241 unique providers enrolled patients. The mean provider age was 40.8 years (SD 8.1) in 2011 with 37.3% (n=90) female (Supplement Table 1). The mean number of years since medical school graduation was 12.5 (SD 8.3).
Among 2,849 identified eligible patients, 1,980 (69.5%) were enrolled by the treating ED physicians in the parent TAFFY study [Figure 1]. Enrolled and non-enrolled patients were comparable in terms of age, sex, comorbidity, and stroke risk scores[29], except that enrolled patients were more likely to have a history of prior AFF as reported elsewhere.[21]
Figure 1. Derivation of Hospitalization Study Cohort from TAFFY Study Cohort*
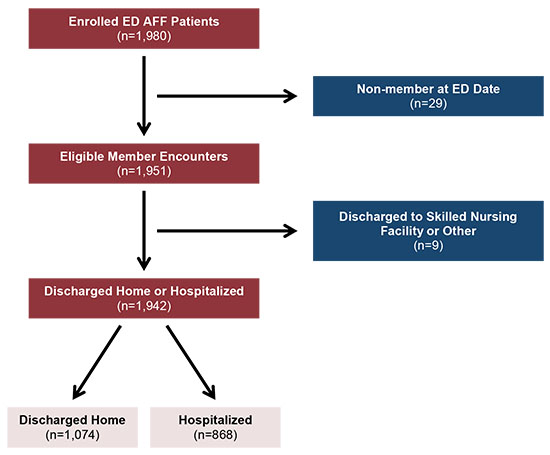
This figure describes how the cohort for the hospitalization study was derived from the TAFFY Study Cohort. On the left side of the figure are boxes describing the flow of patients from encounter to discharge. The patient flow is from “Enrolled ED AFF Patients (n=1,980),” to “Eligible Member Encounters (n=1,951),” to “Discharged Home or Hospitalized (n=1,942)”. After this box, patients may either be “Discharged Home (n=1,074)" or “Hospitalized (n=868)”. Between “Enrolled ED AFF Patients” and “Eligible Member Encounters,” a branching box shows that n=29 patients were excluded from the study as “Non-members at ED Date”.
Between “Eligible Member Encounters” and “Discharged Home or Hospitalized,” another branching box shows that n=9 patients were excluded from the study as “Discharged to Skilled Nursing Facility or Other.”
Adult (≥18 years) health plan members in the ED with electrocardiographically-confirmed nonvalvular AF/FL were eligible for enrollment if their atrial dysrhythmia was either symptomatic (including newly diagnosed) or treated in the ED. Patients were ineligible for the study if they transferred in from another ED, were receiving palliative-only comfort care, had an implanted cardiac pacemaker/defibrillator, or had just been resuscitated from cardiac arrest.
Table 3. Presenting characteristics and treatment of emergency department patients with atrial fibrillation or flutter (AFF), stratified by hospitalization.
| Patient Characteristics |
Total, n=1,942 |
Hospitalized, n=868 (44.7%)* |
Discharge to home, n=1,074 (55.3%)* |
P-value |
| Rhythm Characteristics |
| Diagnosis |
| Atrial Fibrillation |
1,615 (83.2) |
742 (85.5) |
873 (81.3) |
0.04 |
| Atrial Flutter (isolated) |
256 (13.2) |
101 (11.6) |
155 (14.4) |
|
| Both |
71 (3.7) |
25 (2.9) |
46 (4.3) |
|
| Recent-Onset of Rhythm-Related Symptoms (<48 hours) |
| Yes |
915 (47.1) |
277 (31.9) |
638 (59.4) |
<0.0001 |
| No/Unclear |
1,027 (52.9) |
591 (68.1) |
436 (40.6) |
|
| Clinical Impression of Stability |
| Stable |
1796 (92.5) |
738 (85.0) |
1058 (98.5) |
<0.0001 |
| Unstable |
146 (7.5) |
130 (15.0) |
16 (1.5) |
|
| QRS Interval ≥ 0.12 seconds |
201 (10.4) |
126 (14.5) |
75 (7.0) |
<0.0001 |
| Secondary AFFa |
448 (23.1) |
313 (36.1) |
135 (12.6) |
<0.0001 |
| Management Variablesb |
| Attempted Cardioversion |
| No |
1,629 (83.9) |
822 (94.7) |
807 (75.1) |
<0.0001 |
| Yes |
313 (16.1) |
46 (5.3) |
267 (24.9) |
|
| Pharmacological Onlyc |
75 (24.0) |
14 (30.4) |
61 (22.9) |
0.38 |
| Electrical Only |
195 (62.3) |
28 (60.9) |
167 (62.6) |
|
| Both |
43 (13.7) |
4 (8.7) |
39 (14.6) |
|
| ED Consultation with Cardiologist |
688 (35.4) |
220 (25.4) |
468 (43.6) |
<0.0001 |
| Sinus Rhythm at Discharge |
679 (35.0) |
132 (15.2) |
547 (50.9) |
<0.0001 |
| Encounter Characteristics |
| Triage |
| Level 1: Resuscitative |
18 (0.9) |
17 (2.0) |
1 (0.1) |
<0.0001 |
| Level 2: Emergent |
1,140 (58.7) |
527 (60.7) |
613 (57.1) |
|
| Level 3: Urgent |
775 (40.0) |
322 (37.1) |
453 (42.2) |
|
| Level 4: Non-Urgent |
9 (0.5) |
2 (0.2) |
7 (0.6) |
|
| Brought in by ambulance |
587 (30.2) |
370 (42.6) |
217 (20.2) |
<0.0001 |
| ED length of stay (hours), mean (SD) |
5.3 (3.7) |
5.9 (3.4) |
4.9 (3.9) |
<0.0001 |
ED, emergency department;
Overall, the mean patient age was 70.7 years (SD 13.8) and 985 (50.7%) were female. Characteristics of the cohort by hospitalization outcome are described in [Table 1], [Table 2], and [Table 3] (and in greater detail in Supplemental Table 2). The majority of patients were discharged home (55.3%; n=1,074). Hospitalization varied from 37.4% to 60.4% between medical centers in this integrated care system (Supplemental Figure 1). The attributes and hospitalization rates for each of the 7 hospitals are available in the supplement (Supplemental Table 3). Intraclass correlation coefficient estimates indicated that 1.2% of the variability in hospitalization was attributable to providers, while 2.7% was attributable to medical centers, and neither interclass correlation coefficient was significant.
c Pharmacologic cardioversion included the following medications: amiodarone, dofetilide, flecanide, ibutilide, magnesium, procainamide, propafenone, quinidine, and vernakalant. Physicians had the option to indicate if amiodarone was used for pharmacologic cardioversion or rate control. Amiodarone use may be included in both locations.
Among those admitted, 15.0% were considered unstable by the physician compared to 1.5% among those discharged home (p<0.001) [Table 3]. Mean CCI was 2.5 (SD 2.4) among those hospitalized and 1.3 (SD 1.9) among those discharged home (p <0.0001), while anticoagulation status between the two groups was comparable with about one-quarter of patients on prescribed anticoagulant medications (p=0.62) [Table 2]. A minority of patients underwent cardioversion attempts for AFF in the ED: 313 (16.1% of patients enrolled). Of these, 75 (24.0%) received pharmacologic only, 195 (62.3%) electrical only, and 43 (13.7%) received both [Table 3]. Attempted cardioversion varied significantly between medical centers, ranging five-fold between the lowest (5.1%) and highest (27.6%) cardioverting EDs. Among the 1,461 patients (75.2%) who received intravenous rate reduction medications, 26.6% received beta-blockers, 57.8% received calcium channel blockers, and 8.2% received both of these therapies. A small proportion of patients received digoxin, amiodarone, or a combination of these medications in addition to a calcium channel or beta blocker.
In the adjusted Poisson regression model [Table 4], an increased risk of hospitalization was associated most strongly with failure of sinus rhythm restoration by the time of ED discharge, no attempted cardioversion, treatment at hospital G, physician impression of instability, last ED heart rate >100, and no prior history of AFF (all RR >1.3).
Other significant predictors with a smaller relative risk (RR ≤ 1.3) included Black/African American race, QRS interval > 0.12 seconds, CCI ≥ 3, a 1 point increase in TrOPS-BACS Score, triage level as emergent, arrival by ambulance, no ED consultation with a cardiologist, a 1 hour increase in ED length of stay, and treatment at hospital E. Stroke risk (ATRIA Stroke Risk Score) and patient age were not associated with hospitalization in the fully-adjusted model [Table 4]. Differences in characteristics between hospitals G and A included ED census (G: second lowest at 34,869 vs A: second highest at 81,342) and teaching hospital status (G: no vs A: yes).
To explore the impact of cardioversion and rhythm outcome on hospitalization in the adjusted model, we used linear combinations and found that patients with attempted cardioversion who remained in AFF at discharge (n=55) had a non-significant RR for hospitalization of 1.23 (95% CI: 0.88-1.72), whereas those in AFF at discharge without attempted cardioversion had a RR for hospitalization of 1.93 (95% CI: 1.65-2.25). In patients where cardioversion was attempted and the patient left the ED in sinus rhythm, the RR of hospitalization decreased to 0.64 (95% CI: 0.50-0.81).
Table 4. Patient characteristics and facilities associated with hospitalization for AFFa from a modified Poisson regression with provider as random effect. Shaded variables were not included in the final adjusted model.
| Patient Characteristics |
Univariate Models |
Adjusted Model |
| RR |
95% CI |
RR |
95% CI |
| Female (ref: Male) |
1.08 |
0.98, 1.19 |
1.01 |
0.92, 1.11 |
| Age at ED Visit (ref: Age <45) |
| 45-64 |
1.96 |
1.17, 3.29 |
1.31 |
0.82, 2.09 |
| 65-74 |
2.30 |
1.35, 3.89 |
0.91 |
0.55, 1.51 |
| ≥ 75 |
3.10 |
1.87, 5.12 |
0.86 |
0.52, 1.41 |
| Race (ref: White) |
| Black/African American |
1.26 |
1.07, 1.48 |
1.18 |
1.02, 1.36 |
| Asian |
1.17 |
1.01, 1.36 |
1.13 |
0.96, 1.34 |
| Other/Unknown |
0.94 |
0.73, 1.22 |
1.05 |
0.85, 1.28 |
| Low Socioeconomic Status (ref: Not Low) |
1.19 |
1.05, 1.35 |
|
|
| QRS interval > 0.12 seconds (ref: ≤ 0.12 seconds or missing) |
1.46 |
1.30, 1.65 |
1.13 |
1.01, 1.27 |
| Rhythm Characteristics (ref: Paroxysmal) |
| Chronic |
1.70 |
1.48, 1.96 |
|
|
| Unclear |
1.86 |
1.67, 2.08 |
|
|
| Physician Impression of Instability (ref: Stable) |
2.23 |
2.05, 2.43 |
1.44 |
1.30, 1.60 |
| No Prior History of AFF (ref: Prior History) |
1.25 |
1.13, 1.40 |
1.41 |
1.29, 1.54 |
| Onset Was Not Recent/Clear (ref: Recent/Clear) |
1.91 |
1.66, 2.20 |
|
|
| Secondary AFF (ref: Primary) |
1.87 |
1.69, 2.06 |
1.09 |
0.98, 1.21 |
| AFF Rhythm at Discharge (ref: Sinus Rhythm) |
2.97 |
2.50, 3.53 |
1.93 |
1.65, 2.25 |
| Risk Scores |
| Charlson Score (ref: 0) |
| 1 |
1.50 |
1.29, 1.73 |
1.10 |
0.96, 1.26 |
| 2 |
1.66 |
1.40, 1.96 |
1.11 |
0.96, 1.28 |
| ≥ 3 |
2.15 |
1.90, 2.43 |
1.27 |
1.13, 1.44 |
| ATRIA Score [28]-[30] (ref: Low: 0-6) |
| 6 (Medium) |
1.12 |
0.87, 1.43 |
1.13 |
0.86, 1.49 |
| ≥ 7 (High) |
1.79 |
1.59, 2.01 |
1.24 |
1.00, 1.54 |
| CHA2DS2-VASc [31] (ref: <2) |
| 2-4 (Medium) |
1.92 |
1.59, 2.32 |
|
|
| 5-9 (High) |
2.44 |
2.02-2.95 |
|
|
| HAS-BLED [32] (ref: <2) |
| 2-3 (Medium) |
1.98 |
1.71, 2.29 |
|
|
| ≥3 (High) |
2.57 |
2.25, 2.95 |
|
|
| RED-AF Score [20] (10 Point Increase) |
1.04 |
1.02, 1.05 |
|
|
| TrOPs-BAC Score [18] (1 Point Increase) |
1.34 |
1.30, 1.39 |
1.17 |
1.10, 1.24 |
| Triage Level (ref: Non-Emergent and Urgent) |
| Emergent |
1.12 |
0.99, 1.26 |
1.27 |
1.16, 1.40 |
| Resuscitative |
2.22 |
1.90, 2.61 |
1.17 |
0.86, 1.58 |
| Last ED Heart Rate > 100 (ref: <100) |
2.24 |
2.04, 2.46 |
1.44 |
1.31, 1.57 |
| Arrival by ambulance (ref: No) |
1.73 |
1.56, 1.90 |
1.30 |
1.19, 1.41 |
| Rate Control Medications (ref: No Rate Reduction Medications) |
| Any Digoxin Rate Reduction |
1.77 |
1.49, 2.11 |
0.93 |
0.83, 1.05 |
| Non-Digoxin Rate Reduction |
1.14 |
0.99, 1.31 |
1.12 |
0.94, 1.34 |
| No Attempted Cardioversion (ref: Attempted Cardioversion) |
3.40 |
2.56, 4.51 |
1.57 |
1.23, 2.00 |
| No ED Consultation with Cardiologist (ref: Cardiology Consult) |
1.63 |
1.42, 1.88 |
1.23 |
1.10, 1.37 |
| ED Length of Stay (1 Hour Increase) |
1.04 |
1.02, 1.05 |
1.03 |
1.01, 1.04 |
| Facilities [ref: A (low)] |
| B |
1.0 |
0.78, 1.29 |
0.98 |
0.80, 1.21 |
| C |
1.05 |
0.87, 1.27 |
1.13 |
0.97, 1.32 |
| D |
1.22 |
1.00, 1.50 |
1.05 |
0.88, 1.26 |
| E |
1.25 |
1.04, 1.50 |
1.26 |
1.09, 1.47 |
| F |
1.47 |
1.18, 1.82 |
1.18 |
0.95, 1.47 |
| G |
1.61 |
1.35, 1.92 |
1.44 |
1.22, 1.71 |
AFF: Atrial fibrillation or flutter; ED: Emergency department
In this multicenter prospective cohort study of recent-onset AFF patients, we found variation in hospitalization rates similar to other sites.[8], [30] In our study, there was almost a two-fold difference in hospitalization proportions. However, the overall mean hospitalization rates (44.7%) were lower in this healthcare system compared to the Western region of the U.S. (57%) as well as the entire U.S. (70%). Secondly, we found statistically significant predictors of increased hospitalization including any prior AFF episode, a failure to return to sinus rhythm by the time of disposition, no attempted cardioversion, a physician’s impression of an unstable patient, and a final heart rate greater than 100 beats per min at time of disposition. Of these, the factors over which the ED physician may exert some control to reduce hospitalization include rhythm control, that is, effective cardioversion, and adequate reduction of heart rate.
In our study, effective rhythm control was associated with ED discharge to home in the adjusted model, a finding that makes clinical sense and has been demonstrated in the literature.[29], [31] Patients with any cardioversion attempted during an ED stay were less likely to be hospitalized than those without attempted cardioversion, regardless of rhythm at the time of ED discharge after adjusting for other variables. Furthermore, we found that even if the patient remained in AFF at discharge, a cardioversion attempt reduced the risk of hospitalization compared to those without cardioversion (RR 1.23 vs 1.56).
ED patients with a rapid ventricular response to their AFF often have complaints of palpitations and symptoms of left ventricular dysfunction such as shortness of breath and exercise intolerance. Controlling the rapid ventricular response from 150 to 100 beats per minute, for example, improves ventricular function and often reduces symptoms sufficiently to allow discharge home. Sinus restoration is an even more effective means of AFF symptom resolution, as it solves the primary problem that triggered the ED visit. Failure to achieve a sustained reduction in the rapid ventricular response, therefore, is one of the leading reasons ED patients require hospitalization.[31], [32]
The relationship between optimizing rate and rhythm control of ED patients with AFF and their subsequent hospitalization has been demonstrated in a variety of clinical settings where the implementation of ED AFF treatment pathways has resulted in safe and sizable reductions in hospitalization.[33]-[35] Shared among these successful ED models of care are simple, standardized approaches to improve rhythm and rate control, including the early use of oral rate reduction medications. Empowering providers to actively manage these patients with such pathways could increase home discharges as well as decrease variation in hospitalization.
Across the U.S. there are significant regional differences, with ED AFF hospitalizations ranging from 73% in the Northeast and South to 55% in the West.[8], [30] In neighboring Ontario, Canada, one finds a 10-fold difference in AF hospitalization between the top and bottom decile of 154 EDs,[9], [10] as well as wide variation in management among institutions.[9], [10], [36]-[39] Another study comparing differences between the management of AF in Canada and the U.S. reasoned that the latter’s more complex medical system heavily contributed to its increased hospitalizations.[37] Piccino et al. hypothesized that “differences in the financial incentives (and disincentives) for hospitals to admit low-risk patients in the U.S. and Canada may contribute to the variation in hospitalization.” Unlike many parts of the U.S. however, our health system is integrated and allows greater access to timely follow-up; thus, our study likely represents the most optimal conditions in the U.S. for an outpatient disposition.
This hypothesis may be valid as integrated health systems do not directly benefit from hospitalization as a path to optimizing a members’ health. Instead, supporting outpatient management by facilitating timely follow-up care with a primary care physician or anticoagulation management service, can lower the threshold for safely discharging a patient home. For example, clinicians in this integrated health system were provided point-of-care clinical decision support for patients with pulmonary embolism in a controlled pragmatic study. The intervention increased home discharges by 11.3% and had no effect on 5-day return visits related to pulmonary embolism or 30-day major adverse outcomes.[40] At facilities where such integrated care is unavailable, the threshold to admit may be lower than to discharge home, as obtaining follow-up care can be an additional burden in the time-pressured setting of the ED.
A study by Rozen et al. showed a steady surge in the absolute numbers of ED visits for AF resulting in an overall increase in hospitalizations and, correspondingly, the cost to the healthcare system.[30] Without a dramatic shift in how hospital systems manage the transitions of care and improved management guidelines for providers with patients with AF, there is unlikely to be any change in hospitalization volumes. Cultural differences within settings can be difficult to overcome unless sweeping changes are made throughout a system, from the ED, inpatient services, and outpatient services, to the pharmacy. Similar to how the care of ST-elevation myocardial infarctions was entirely transformed with door-to-balloon time standards[41] and now emergency medical services (EMS)-to-balloon time, perhaps the same may need to occur for a transformation in comprehensive AF care.
Until recently, the professional society guidelines on the approach to patients with AF have offered divergent recommendations on management.[42]-[45] Moreover, several of these guidelines have undergone frequent updates over a short period of time,[12] making it more difficult for providers to stay current. However, in the past few years, there has been a shift towards multidisciplinary panels seeking to guide ED providers on AF management. Canada has been a leading force on ED-specific guidelines,[14], [45]-[47] and much can be learned by their unified front. Further studies will be needed to determine whether such guidelines make an impact on ED management, hospitalization, and subsequent clinical outcomes.
Facility-specific variation abounds in the U.S., as each hospital system can be a unique entity with its own variety of observation units, consultant availability, outpatient follow-up care, as well as provider practice variations. These variations can make it more challenging to implement widespread practice changes; and in fact, it could be that changes need to occur system by system, each designing their own tailor-made plan that may also include protocols facilitating discharge of new-onset AF patients. Society guidelines and web-based applications (e.g. healthdecision.org) can nevertheless provide hospitals templates of clinical pathways that can be customized for unique systems.[48], [49] Other opportunities to increase professional guideline uptake may include the integration of clinical decision support tools into EHR systems.[40], [50]
Our study population was a convenience sample and may be subject to selection bias despite representativeness of the greater population on measured variables. The data are from 2011-2012 and practice patterns may have evolved in the subsequent years. The study sample was relatively small, which accounts for the moderate confidence intervals, and thus we might fail to detect associations of smaller magnitude. Our data also did not account for ED recidivism. Due to the limited number of hospitals involved, their characteristics could not be assessed as predictors; the hospitals were, however, similar in their basic capacity and function. Our study was conducted in a large integrated health care system in California which may limit the generalizability of our results to other geographic locations and practice settings. However, this dataset allowed for clinical data with a high degree of internal validity—features that cannot be found in claims-based datasets. As integrated health systems tend to have fewer system-level differences (e.g., one primary insurance program, a unified EHR, a means for facilitating follow-up), variations in an integrated health system are likely conservative estimates.
While hospitalization rates of AFF patients vary among medical centers within a single integrated healthcare system, there are modifiable factors that could decrease hospitalizations. Physician management decisions could be improved by standardizing treatment goals that specifically address best practices for ED rate reduction and rhythm control.


