Cardiac Image Registration: Rotational Error
Correction and Gated Stabilization for Cardiac
Motion
Jasbir S. Sra, MD1, Elisabeth Soubelet, PhD2, Regis Vaillant, PhD2, David Krum, MS1, John Hare, BS1, Barry Belanger, PhD3, Indrajit Choudhuri, MD1, Anwer Dhala, MD1, Vikram Nangia, MD1, M. Eyman Mortada, MD1, Atul Bhatia, MD1, Zalmen Blanck, MD1, Ryan Cooley, MD1, Masood Akhtar, MD1
1Aurora Cardiovascular Services, Aurora Sinai/Aurora St. Luke’s Medical Centers, University of Wisconsin School of Medicine and Public Health, Milwaukee, WI.2GE Healthcare, Buc, France.3GE Healthcare, Waukesha, WI.
Dynamic motion of the heart due to cardiac and respiratory cycles, and rotation from varying patient positions between imaging modalities, can cause errors during cardiac image registration. This study used phantom, patient and animal models to assess and correct these errors.
Rotational errors were identified and corrected using different phantom orientations. ECG-gated fluoro images were aligned with similarly gated CT images in 9 patients, and accuracy assessed during atrial fibrillation (AF) and sinus rhythm. A tracking algorithm corrected errors due to respiration; 4 independent observers compared 25 respiration sequences to an automated method. Following correction of these errors, target registration error was assessed. At 20 mm and 30 mm from the phantom model’s center point with an in-plane rotation of 8 degrees, measured error was 2.94 mm and 5.60 mm, respectively, and the main error identified. A priori method accurately predicted ECG location in only 38% (p=0.0003) of 313 R-R intervals in AF. A posteriori method accurately gated the ECG during AF and sinus rhythm in 97% and 98% of 375 beats evaluated, respectively (p=NS). Tracking algorithm for ECG-gated motion compensation was identified as good or fair 96% of the time, with no difference between observers and automated method (chi-square=25; p=NS). Target registration error in phantom and animal models was 1.75±1.03 mm and 0 to 0.5 mm, respectively.
Errors during cardiac image registration can be identified and corrected. Cardiac image stabilization can be achieved using ECG gating and respiration.
Key Words : Imaging, Ablation, Atrium, Registration, Atrial Fibrillation.
Correspondence to: Jasbir S. Sra, MD, FACC, FHRS, 2801 W. Kinnickinnic River Parkway, #777, Milwaukee, WI 53215.
Dynamic motion of the heart, spatial errors due to systole and diastole, and phasic changes during respiration can cause changes in chamber size and position during left atrial (LA) registration, an area of current interest.1-9 Gating to both the cardiac cycle and respiration could potentially help reduce these errors. Another source of error could be due to different patient positions at the time of imaging and during the interventional procedure. Although for the purpose of this study a 2D-3D registration model was used, these errors can be common to both 3D-3D and 2D-3D image registration.One important difference, however, between 3D and 2D registration is that fluoroscopic images are conic projections. In contrast, computed tomography (CT) images represent the synthesis of many X-ray projections obtained circumferentially around an object. Therefore, during CT-fluoro fusion (CT-FF), in addition to the errors described above, fusion and visualization of 3D images with conic projections from 2D fluoroscopy can cause image distortions and need to be taken into account.
This study was designed to identify and evaluate corrections for a) in-plane and out-of-plane rotational errors that would reflect changes in patient position, b) cardiac cycle motion, and c) LA motion during respiration. Finally, following correction of these errors, any target registration error in the phantom and animal model was identified by marking or delivering ablation points to the implanted beads using only registered images.
The study included the use of phantoms, patient data and an animal model. The initial part of the study used phantom and patient data to assess rotational errors and cardiac motion as well as motion due to respiration. A subsequent part of the study assessed target registration error in the phantom and an animal model, where implanted beads were targeted for ablation using the registered images.
The Institutional Review Board approved the study and all patients gave informed written consent. Animal studies were performed at the Aurora Sinai Medical Center Research Laboratory (accredited by the American Association for Accreditation of Laboratory Animal Care) and approved by the institute’s Research Subcommittee for Animal Studies.
Phantoms were scanned in a normal fashion with CT, while canine model and patients were scanned with contrast-enhanced, ECG-gated CT scan (LightSpeed® Ultra, GE Healthcare, Waukesha, WI). The process of imaging and segmentation of the LA has been described previously in detail.10-12 Retrospective ECG-gated reconstruction of the axial slices was performed at the point in the cardiac cycle that yielded the best image quality, approximately 70% to 80% phase location. The native slice acquisition thickness was 1.25 mm. Left atrium, superior vena cava (SVC), and coronary sinus (CS) were segmented using CardEP™ software (GE Healthcare, Waukesha, WI), which has been described in detail in the literature. Postprocessing software allowed these data segments to be seen separately or together.
Registration was performed on the registration platform (Advantage™ Windows workstation, GE Healthcare, Waukesha, WI) as previously described.4 Essentially, prior to registration, a 6F decapolar catheter (St. Jude Medical Inc., St Paul, MN) was placed in the CS. A transformation process that linked the catheter imaged on the fluoroscopy system to the SVC and CS segmented from the CT images was used to register the 3D-CT model with the 2D fluoroscopy images. A multielectrode basket catheter with 64 unipolar electrodes (Constellation®, Boston Scientific Corp., Natick, MA) and a mapping and ablation catheter (ThermoCool®, Biosense Webster Inc., Diamond Bar, CA) were placed in the superior pulmonary veins (PVs) after transseptal catheterization in the patient part of the study. The fluoro images were transferred to the registration platform. Similarly, the appropriate ECG signals were identified and transferred from the CardioLab™ (GE Healthcare, Waukesha, WI) to the registration platform. Fluoro images were also gated to the ECG as the CT images.
Conic vs. Parallel Projection
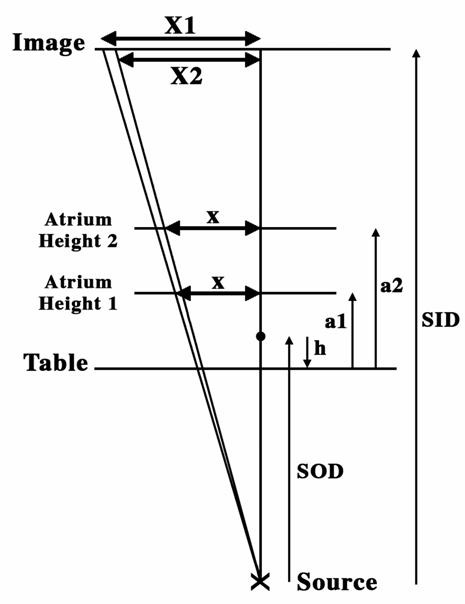
In order to fuse the 3D-CT model data with the 2D fluoro projection image, the 3D-CT model data must first be projected into a 2D image that can be registered with the fluoroscopic image. Typically, 2D projection images are created from a 3D-CT image dataset by a parallel projection process, which is analogous to 2D projection imaging with the X-ray source infinitely distant from the anatomical object and detector. Parallel projection has the advantage of preserving the integrity of distances measured between objects in an x-y plane (perpendicular to the central X-ray) at any depth in the z direction (parallel to the central ray) in the anatomy. However, X-ray projection imaging embodies an inherent projection distortion due to the fact that the X-ray source is a finite distance from the anatomy being imaged. As a result, objects closer to the source are magnified more than objects more distant from the source in the projected image, and there is no way to resolve these ambiguities without knowing the positions of the objects of interest along the z-axis. Figure 1 is a representation of the problem that could occur from overlaying 3D parallel projection images of CT on 2D conic projection images seen on fluoro. If a1 and a2 are two points located 20 mm from the center (straight line), these points will be projected as X1 and X2, resulting in an error on the location of a point in the image. For measurements of projection distortion using 3D-CT models, values of 20 mm and 30 mm were used. The difference in markings in the upper scale on the CT images versus scale marks on the fluoro images was measured, as indicated in Figure 1, to assess the conic projection error. Custom-designed postprocessing software was used to correct this error.
Figure 1. Representation of the distortion due to conic projection of the 3D model during 3D-2D cardiac image registration. See text for details
Phantom studies were designed to address the following: in-plane and out-of-plane rotation error and target registration error using rigid-body registration process. For those studies not assessing the target registration error, a custom phantom constructed of 1-inch (2.54 cm) thick plexiglass plates and two scales Figure 2 was used. The scales were essentially printed circuit boards with two perpendicular rulers (marked in centimeters) and five concentric circles (with 1-inch increments in radii) traced into each of them. The scales were placed such that one was rotated 45 degrees in plane relative to the other and separated by two of the plexiglass plates. The plexiglass had pegs that fit tightly into a pattern of holes in the plates and scales. In the phantom model, by adjusting the VR opacity bounds, it was possible to visualize just the scales and filter out everything else, including the plexiglass plates.
Figure 2. Custom phantom used in the study. A representation of the phantom depicting top and side views along with measurement scales (Panel A). Scales, which are circuit boards separated from each other by plexiglass (Panel B). Fluoro image of the phantom (Panel C). See text for more details
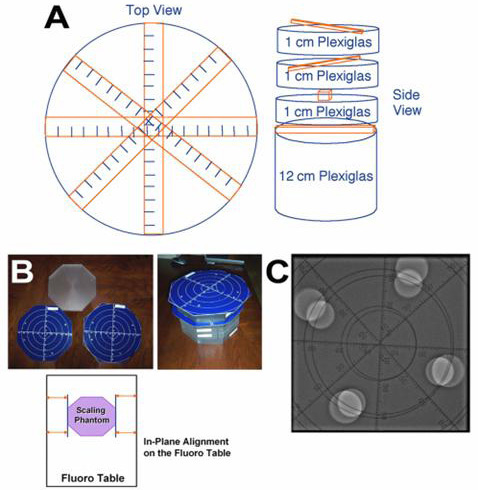
Out-of-plane alignment of the phantom on the CT and fluoro tables was accomplished using a spirit leveler. For in-plane alignment, precise lines were marked on the fluoro table and the phantom was aligned with these markings Figure 2. Lower scale was 4 inches (10.16 cm) above the fluoro table, and upper scale was 6 inches (15.24 cm) above the fluoro table. In both CT and fluoro images, the length of the 1-cm caliper was measured and compared to the markings on the appropriate scale. The length of the 1-cm caliper matched the length of the 10-mm mark along the scale that was at the right calibration height. CT markings were scaled and aligned with fluoro markings, and the 1-cm caliper length on the CT image matched the 1-cm mark on the fluoro image. For the purpose of this study, two distances, 20 mm and 30 mm, were used from the center point of the image. For target registration error, the plastic model of the LA used was Angiogram Sam® (Medical Plastics Laboratory Inc., Gatesville, TX).
In-plane and Out-of-plane Rotation Error
For the purpose of this study, in-plane rotation was defined as any rotation in a horizontal plane about the vertical axis going through the center of the phantom. Out-of-plane rotation was defined as any rotation about a horizontal axis going through the center of the phantom.
In-plane rotation was achieved by making markings relative to the original alignment markings on the fluoro table with the aid of a common protractor, and aligning the phantom to their markings. Out-of-plane rotation was achieved by raising one end of the phantom using sheets of paper, and verifying the angle of rotation with a common protractor. For this study, in-plane rotation of 8 degrees was applied to the plantom. For the analysis of out-of-plane, a 5-degree rotation was applied to the phantom in the right-to-left and craniocaudal directions, respectively.
Target Registration Error
Eleven glass beads (1 mm in diameter) were attached to the left atrial surface of a cardiac phantom. These glass beads are easily visualized on the CT and CT-FF but not on the fluoroscopy image. The LA, SVC and CS were segmented, and the phantom was positioned on a fluoroscopic table. A 20-pole 7F CS catheter (St. Jude Medical Inc., St. Paul, MN) was placed inside the CS and the fluoroscopic images were acquired. Following this, registration was performed as described previously, using a transformation that superimposed a CS catheter placed inside the phantom during fluoroscopy over the segmented SVC and the CS from the CT model. A mapping catheter was brought into contact with the glass beads (which were not used for registration) using the CT-FF image only. The distance between the catheter, as seen on fluoroscopy, and each bead as it appeared on the CT-FF, was measured to determine the target registration error.
ECG data from 9 patients was used for the ECG-gating study, while data from 17 patients was used for the respiration motion study.
ECG Gating for Cardiac Cycle Motion
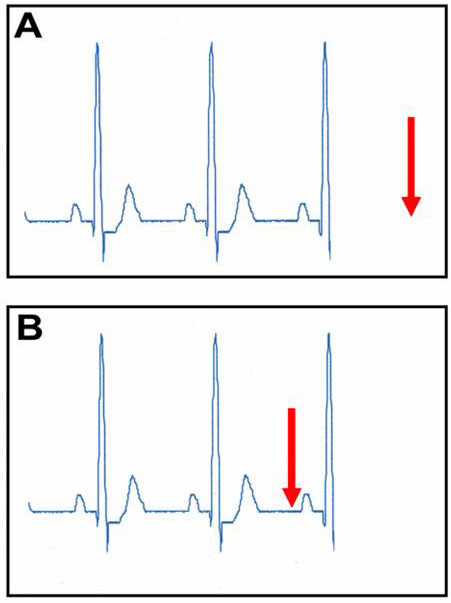
The a priori method used a moving average of the prior 10 R-R intervals to predict the optimum timing for image registration, while the a posteriori method used 75% of the previous R-R interval to select the proper fluoroscopic image within that R-R interval Figure 3. Latency was defined as the lag between the time when the correct fluoroscopic image was acquired and the time when the next QRS complex was detected by the software and depicted on the screen.
In atrial fibrillation (AF), the a priori method was triggered to adjust the image for 375 beats; 313 of these were replayed in a posteriori method. In sinus rhythm, the a priori method was triggered to adjust the image for 370 beats, and the a posteriori method was triggered to adjust the image for 377 beats.
Figure 3. “A priori” (Panel A) and “a posteriori” (Panel B) ECG-gating technique
Respiratory Motion Compensation
For the respiration motion study, a database was created by recording a series of 25 ECG-gated fluoro image sequences from 17 patients undergoing AF ablation. The results of a two-step validation procedure were used to assess the performance of this respiration tracking. In the first step of the validation procedure, a mathematical evaluation of the algorithm was conducted. The locations of the multielectrode catheter in one of the superior PVs and the mapping and ablation catheter close to the ostium in the other PV were marked on each of the fluoroscopic images through the entire sequence for at least two respiratory cycles. The motion of these catheters represented a reference for respiratory motion. A custom-designed algorithm was applied to each of the sequences in the database. The algorithm picked up location of catheters in the soft tissue (heart) as they moved in real time with the respiration and created a tracking template for moving the CT-fluoro fused image with them. The results of the tracking algorithm were automatically computed using the absolute difference in pixels between it and the reference.
In the second step of the validation process, the same fluoro sequences were registered with their corresponding left atrial CT images, and the motion of the LA throughout the respiratory cycle was tracked. The accuracy of the respiration motion tracking was evaluated clinically by 4 independent operators and categorized as good (perfect tracking), fair (small jumps in the localization of the catheters), or poor (big jumps once in a while inducing misregistration of the catheters). The two methods were then compared for correlation of results.
A mongrel dog (weight approximately 25 kg) was used for the target registration phase of this study. The animal was sedated with intravenous sodium pentothal (25 mg/kg) and intubated. Anesthesia was maintained with 1.0% to 1.5% halothane. Using aseptic techniques, a left lateral thoracotomy was performed, and two platinum beads 1 mm in diameter, which would be visible on CT and fluoroscopy, were implanted.
Imaging with the CT scanner and experimentation for target registration was performed on the same day. Right atrial segmentation was performed using the contrast-enhanced CT, registered using a CS catheter placed in the CS and visualized on fluoroscopy. Radiofrequency lesions were positioned over two different beads using CT-FF only, and were motion compensated and ECG-gated. The operator during the navigation and ablation part of the experiment was blinded to fluoroscopy images and only used CT-FF for guidance. A radiofrequency lesion was delivered at each of these locations (30 Watts for 30 seconds). After all of the lesions were accomplished, the animal was euthanized. The heart was removed, and the locations of the lesions were visualized by staining the heart with 2,3,5-triphenyltetrazolium chloride. The distance from the implanted beads to their corresponding lesions was measured and the sites were photographed. If a lesion touched the implanted pacing electrode, the distance was recorded as 0 mm. In all other instances, the distance from the center of the lesion to the nearest portion of the implanted bead was recorded.
Statistical Analysis and Definitions
Results are expressed as mean ± 1 standard deviation for continuous data and as percentages for dichotomous data. Chi-square analysis was performed between the mathematical and clinical models to assess motion compensation outcomes. In the present study, the target registration error was defined as the distance from the ablation location to the implanted beads on the phantom and animal models that were targeted.
In-plane and Out-of-plane Rotation Errors
Figure 4, Panel A depicts an in-plane rotation of 8 degrees of the phantom in the fluoro image only. Figure 4, Panel B depicts the same fluoro image with the registered CT image. However, no in-plane rotation has been applied to the CT model. To analyze the error, the horizontal axis was examined, and the length measured was the distance between the markings on the CT model (no rotation) and the fluoro scale at an 8-degree in-plane rotation to the phantom.
Figure 4. Demonstration of in-plane rotation error and its correction. The fluoro image of the phantom, which has been rotated by 8 degrees (Panel A). The CT-fluoro registered image (Panel B). However, the CT image is not rotated. In Panel C, the CT image has been rotated by 8.5 degrees to correct the in-plane rotational error as, unlike in Panel B, scales on the CT and fluoro image align perfectly
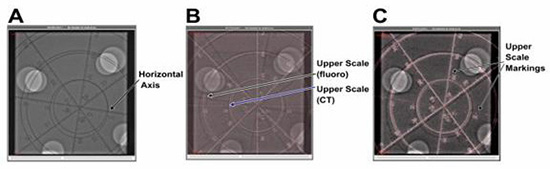
When taking points at 20 mm and 30 mm at an in-plane rotation of 8 degrees of the phantom, the measured error was 2.94 mm at 20 mm and 5.60 mm at 30 mm. As depicted in Figure 4, Panel C, rotating the CT model by 8.5 degrees eliminated this error. For calculation of out-of-plane rotation using a 5-degree rotation, error at 20 mm and 30 mm was 1.1 mm and 0.9 mm, respectively.
In AF, the a priori method was triggered with 38.3% accuracy. When sequences were replayed in a posteriori, there was 95.8% accuracy, p=0.0003. In sinus rhythm, the a priori method had 97.5% accuracy and the a posteriori method 98.2% accuracy, p=NS. The a posteriori method introduced an average of approximately 187 ms of latency into the registration process during AF and 218 ms during sinus rhythm. Figure 5 depicts an ECG-gating window in sinus rhythm and AF, and latency during registration. Latency, as depicted in the figure, is the lag between the time when the correct fluoroscopic image is acquired (green arrow) and the time when the next QRS complex is detected (green dot). This suggests that the images can be seen almost instantaneously.
Figure 5. ECG gating during atrial fibrillation and sinus rhythm using “a posteriori” method. Latency, the time between when the fluoro images are acquired (green arrow) and when the inscribed QRS is detected (green dot), is minimal, thus the images appear almost instantaneously
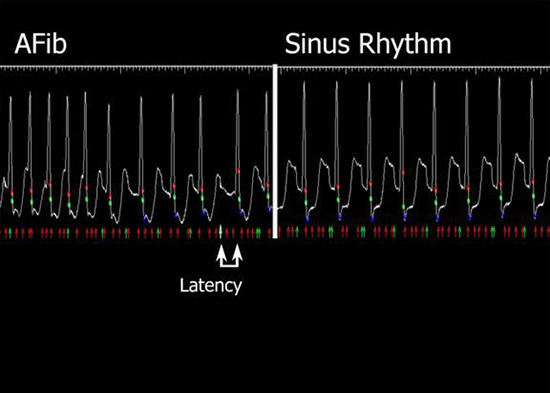
The a posteriori method of ECG gating was thus significantly more accurate than the a priori method when patients were in AF, while both methods were equivalent when patients were in sinus rhythm.
Respiratory Motion Compensation
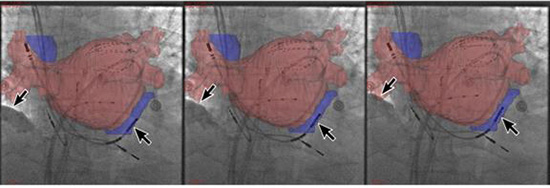
In the first step of the validation process, using 504 images from the database, the tracking algorithm was good in 72% of cases, fair in 24% and poor in 4%. In the second step, clinical evaluation by 4 independent operators reviewing 25 prerecorded sequences rated 69% good, 29% fair and 2% poor. All sequences were replayed using the a posteriori ECG-gating method. The range between the operators’ sequences assessed as good, fair or poor was 60% to 76%, 20% to 36% and 0% to 4%, respectively. There was an 87% reproducibility of the results on a subsequent analysis of 5 sequences by 3 observers. A chi-square analysis comparing the mathematical versus clinical results demonstrated that there was no difference between the two techniques in regard to outcomes using tracking algorithm and operator-based analysis (chi-square=25, p=ns). Of the 25 sequences evaluated, 10 sequences were found during sinus rhythm and 15 during AF. Figure 6 depicts one example of motion compensation during the respiration cycle.
Figure 6. Demonstration of motion compensation in an ECG-gated CT-fluoro registered image. Images are taken during maximum inspiration, in-between and during maximum expiration, as depicted by arrows showing the location of the diaphragm. The relationship between the coronary sinus, the coronary sinus catheter, and the multielectrode basket catheter and the pulmonary veins stays stable throughout the respiration cycle
Target Registration Error
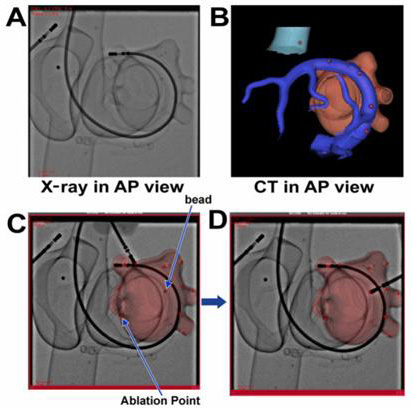
Table 1 depicts distance in millimeters from the bead to the centroid of the catheter tip recorded in CT-FF on 3 different angulations during target registration, using the rigid-body transformation in the phantom models. The mean distance was 1.75 ± 1.03 mm, range 0.19 to 3.23 mm. All beads could be identified on the CT-FF Figure 7.
Table 1. Distances in Millimeters from the Center of the Bead to the Centroid of the Catheter Tip, Taken in three Views With the CT-Fluoro Fusion System
| View |
Average (mm) |
Minimum (mm) |
Maximum (mm) |
| Anteroposterior |
1.25 |
0.21 |
2.95 |
| Left anterior oblique |
2.20 |
0.31 |
3.45 |
| Right anterior oblique |
1.80 |
0.06 |
3.29 |
| Mean error (mm) |
1.75 |
0.19 |
3.23 |
| Mean error was 1.75 ± 1.03 mm. |
|
|
|
Figure 7. Target registration in a rigid-body registration. Panels A and B are fluoro images and CT images of the phantom in the anteroposterior orientation (AP), respectively. Panels C and D are registered images showing implanted beads and marked ablation points. It can be appreciated that the glass beads are only visible on the CT image or the registered image, thus allowing navigation and targeting of these beads only on the registered image
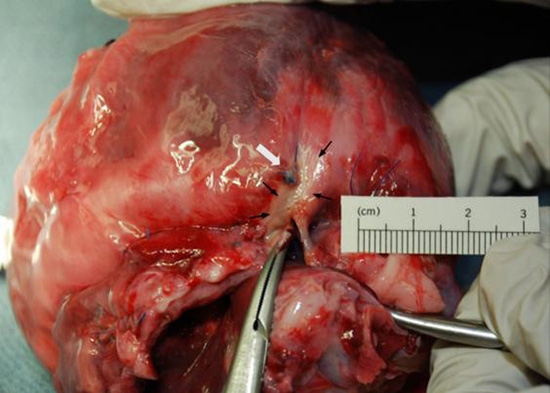
An example of the ablation marking and its relationship to the bead in the animal model experiments is depicted in Figure 8. There was no target registration error targeting the beads implanted in the animal model for ablation when the distance between the border of the bead and ablation lesion was used as the measure. When distance between the centroid of the bead and the lesion was used as the measure, the error was 0.5 mm.
Figure 8. Target registration error in an animal model. Location of implanted bead and ablation lesion. ECG gating and respiration motion compensation has been performed already prior to targeting the implanted bead on the registered image
Conic and Parallel Projection
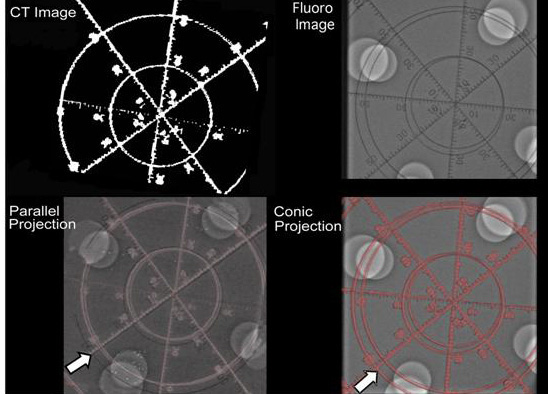
Measurement at marks distanced 20 mm and 30 mm from the center independently gave an error of 3.46 mm at 20-mm distance and 4.26 mm at 30-mm distance for the upper and lower scales, respectively. The conic projection of fluoro images does cause a relatively significant error in the registered 3D image. For the purpose of explanation, Panel A in Figure 9 is an example of parallel versus conic projection. Figure 9, Panel B depicts a 3D image in parallel image. Instead of the alignment of green and blue dots seen in the conic projection, the parallel projection of the 3D model aligns the green dot with the red dot on the right panel. The distance between the blue and green dots represents the error (X1-X2) depicted in Figure 1. Figure 9, Panel C depicts an image in conic projection once the error has been corrected using customized rendering software. In Panel C, the CT has been morphed into a conic projection, thus aligning the blue dot with the green dot. The green dot, being closer to the source, is projected as a larger dot, as is expected in fluoroscopic projections. Figure 10 further depicts the error from parallel projection of the CT and its correction by the rendering software in the phantom study. Upper left panel in Figure 10 is a CT image of the phantom as depicted in previous examples. Upper right panel in Figure 10 is the fluoro image of the same phantom.
The CT image has been prepared using a standard rendering tool to perform the projection of the 3D model and, therefore, is done in parallel projection as shown in Figure 10, lower left panel (CT-FF using parallel projection); the solid and open arrow depicts the error from parallel projection. Lower right panel in Figure 10 depicts the same CT-FF using conic projection, where postprocessing software used in the CT-FF corrects the error by scaling or morphing the CT model to be projected appropriately using conic projection.
Figure 9. Demonstration of conic and parallel projection errors using a 3D model such as CT. Panel A depicts an example of parallel versus conic projection. Panel B depicts a 3D image in parallel image. Panel C depicts a CT image morphed into a conic projection
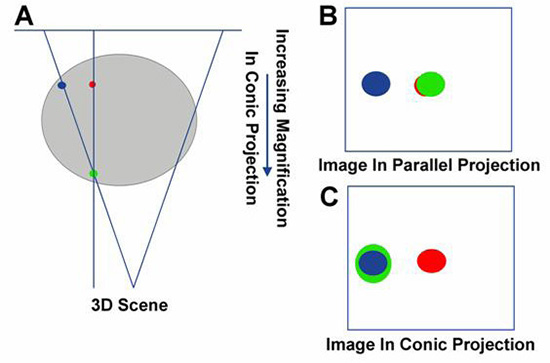
Figure 10. Demonstration of parallel projection and conic projection in the experimental phantom model. White arrow in the lower left panel depicts the distortion during parallel projection between the CT and fluoro image following registration. Lower right panel (arrow) shows that the distortion has been corrected by creating a conic projection of the 3D-CT model using the algorithms outlined in the study. See text for more details
Intermodal registration algorithms assume that the images involved represent identical objects, residing in different image spaces.13-16 The registration transforms one space into the other and then physically aligns the object, via transformations, within that space. The specific type of registration considered here is 2D-3D, however, the errors and their correction discussed herein apply to any of the currently used cardiac registration techniques.
Errors common to intermodal registration can be described as numerical, resulting from computation or measurements. While movements that occur in the same plane will be addressed by most algorithms, movements that occur out of plane due to different positions of the patient, for example due to long interscan times, may be difficult to address and cause other forms of errors. Similarly, cardiac motion during the cardiac cycle and respiration can cause deformations, i.e. nonrigid-body transformations that are continuous may not be predictable.17-19 This study evaluated these errors in a systemic fashion and assessed techniques to correct them to enable appropriate cardiac image registration.
Out-of-plane rotations of the cardiac chambers can occur with changes in the orientation of the body. Errors may occur due to time lapse between the scans, CT or magnetic resonance imaging (MRI) to fluoro or other imaging modalities, and because of differences in imaging table surfaces, such as curvature and cushioning, and different positioning of the patient. It is critical to identify and correct this interscan movement. To help ensure that the cardiac chamber has the same orientation during both imaging sessions, efforts should be made to align the patient identically on the table during both imaging sessions. As demonstrated in the present study, in-plane rotation is more likely to cause these errors if there is variability in patient alignment and posture.
It is expected that the out-of-plane rotation will have the same 3D error since the rotation is really just an in-plane rotation about a horizontal axis in the 3D modality. However, as compared to in-plane rotation, out of-plane rotational error was found to be minimal in the current study. Identification of these errors is critical and possible, as demonstrated in this study, and can be corrected.
Cardiac and Respiratory Motion Errors
The displacement of the heart due to respiration has also been identified as a source of error in a number of studie.20-21 It has been determined that translational movement in the craniocaudal direction is the main type of movement experienced by the cardiac chamber due to respiration. Less significant movements include translations and rotations in other directions. A gating technique during CT imaging involves a patient holding his/her breath in expiration for several heart beats, during which time 2D axial slices are sequentially obtained at fixed points of the cardiac cycle. These slices are stacked and interpolated to create a smooth and static 3D-CT image.
The current study took into account these errors and described techniques to correct them. It is possible to create optimal ECG-gated fluoroscopic images and integrate them with similarly acquired CT images. The a posteriori method seems to be more accurate than the a priori method, especially if a patient is in atrial fibrillation. It is possible to track catheters placed inside the heart to compensate for registration errors due to respiration motion. The study validated this technique using patient and animal data. The technique proved quite easy to use in almost all patients. Further study on the use of this technique in a larger cohort of patients is needed.
However, target registration errors were minimal and acceptable in both rigid models using a phantom model and in animal models in which cardiac gating and respiration-tracking algorithms were enabled. The study clearly demonstrated that it is possible to take into account errors due to dynamic motion of the heart and largely correct these errors using appropriate algorithms.
Validation is implicitly a quantification of the integrity of a registration application and the particular choices made in registration algorithm design. The cardiac cycle is not always regular, and there may be changes in the heart’s rhythm from the time of the CT scan to fluoroscopic session. Although some error could be induced due to these changes, the a posteriori method was equally effective in reconstruction of the 3D image with ECG gating whether the rhythm was sinus or AF. Intermodal registration algorithms assume that the images involved in the registration represent identical objects residing in different image spaces. Potential changes in volume from the time of the CT scan to the fluoroscopic session could cause errors. Therefore, it is important that the time lapses between imaging sessions are not too long. Due to ambiguities involved in addressing the nonpredictive and significant nature of cardiac movement, there may be other ways in which the design of validation strategies could be approached. Despite the possible limitations dedescribed above, this study addressed the main errors that could occur during the process of cardiac image registration and detailed and evaluated the means to correct them.
Knowledge of the various sources of error possible during registration is key to establishing a gold standard for use of intermodality image registration, since these errors will have to be addressed in the design of any registration algorithms. This study systematically examined three significant sources of registration error – change in patient position during interscan interval, cardiac motion and respiration motion, as well as conic vs. parallel image distortions during 3D-2D image registration – and corrections for these errors using phantom, animal and patient studies. Furthermore, these algorithms were then successfully applied to achieve appropriate target registration.


