Role of Echocardiography in the Management and Prognosis of Atrial Fibrillation
David I Silverman, MD, Joseph R. Ayirala, MD, Warren J Manning, MD
Cardiology Division of Hartford Hospital, Hartford, CT and the Departments of Medicine (Cardiovascular Division) and Radiology, Beth Israel Deaconess Medical Center, Harvard Medical School, Boston, MA.
Echocardiography plays a longstanding and vital role in the management of atrial fibrillation (AF). Advances in 2D imaging, Doppler echocardiography and strain imaging have all contributed to major progress in AF treatment. Echocardiographically measured left atrial (LA) volume is a powerful predictor of maintenance of sinus rhythm following cardioversion as well as risk of thrombus formation and thromboembolism. Doppler derived parameters of atrial mechanical function including atrial ejection force provide related prognostic information. Transesophageal echocardiocardiograpy (TEE) guided cardioversion of AF allows for rapid conversion to sinus rhythm without prolonged oral anticoagulation, and TEE serves as a useful tool during catheter ablation of AF and atrial flutter. Newer measures derived from speckle tracking offer great promise in further improving the care of patients with AF.
Correspondence to: David I. Silverman, MD, 80 Seymour St. Hartford, CT 06102.
Almost since its clinical introduction 50 years ago,echocardiography has played a vital role in the management of atrial fibrillation (AF).That role continues to expand as advances in both echocardiographic technology and arrhythmia treatment combine synergistically. The revolution in catheter based treatment of AF has increased the demand for more precise imaging from a variety of modalities,including transthoracic(TTE),transesophageal (TEE), Doppler echocardiography and speckle tracking. Increased precision in assessment of left atrial (LA) anatomy and function made possible by advances in these modalities has enhanced our understanding of the natural history of AF, and has provided superior tools for assessment of treatment efficacy.In the following pages, we undertake to review the many contributions of echocardiography to AF management and to highlight recent advances orgin echocardiographic imaging relevant to the management of this most common arrhythmia.
Estimation of LA size in the setting of AF
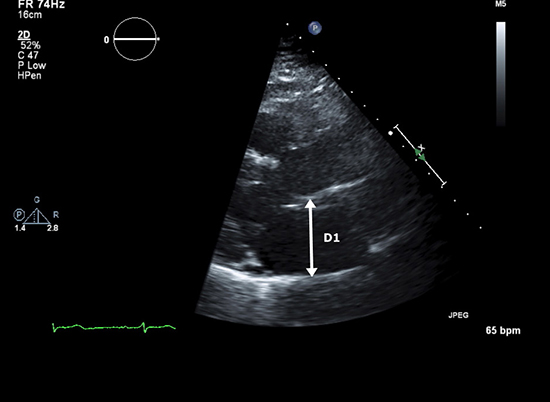
Quantification of atrial volumes using digitized images has produced major advances in our understanding of the relationship between LA size and both short and long-term outcome in patients with AF. LA volume may be estimated by several techniques.1 The simplest but least accurate formula for calculation of LA volume assumes the chamber takes the shape of a sphere and cubes it along 3 axes using the AP dimension; LA-Cube = 4/3 π(APDimension/2)3.2 This method’s major drawback is the inherent inaccuracy of the sphericity assumption, as well as the reality that any error in AP dimension will be multiplied 3-fold. An alternative ellipsoid model uses the LA M-mode AP dimension from the parasternal long axis view (D1), the LA minor diameter in the longaxis view (D2), and the length of the LA from roof to the center of the closed mitral valve at end systole from the apical four-chamber viewsas (4π/3)(L/2)(D1/2)(D2/2) (Figures 1a and 1b).
Figure 1a. The anteroposterior dimension (D1) obtained in the parasternal long axis view is used for the ellipsoidal estimation of left atrial (LA) volume.
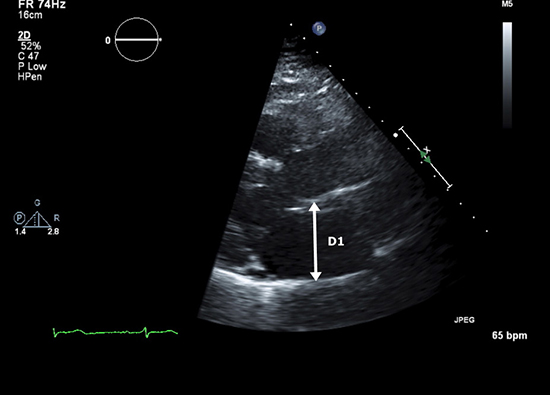
Figure 1b. The LA minor dimension (D2) and LA length from the roof of the atrium length (D3) obtained in the apical 4-chamber view complete the 3 axes required for the calculation; (4π/3) (L/2)(D1/2)(D2/2)

Both of these methods have largely been supplanted by either the area-length method3 or the biplane method of discs (Simpson’s rule). The area-length method assumes an ellipsoidal shape to the LA and consequently applies the formula for calculation of an ellipse by measuring the LA area in the 4-chamber and in the 2-chamber views;LA volume(area-length) = (0.85 * LA area(4 chamber) * LA area(2 chamber))/Shortest LA length
The area-length method’s inherent disadvantage is its primary assumption of LA three-dimensional (3D) shape. For dilated or otherwise deformed LA, the method may either over or underestimate true LA volume.
Calculation of LA volume using Simpson’s rule, now available on most sonographs and off line analysis systems, represents the current gold standard for LA volume measurement (Figures 2a and 2b).4 The method’s advantages are analogous to those appreciated for left ventricular (LV) volume estimation, as its accuracy does not depend upon geometry or symmetry of 3 dimensional LA shape. In contrast to the primary limitation to LV biplane measurements (inadequate endocardial visualization), poor blood tissue interface definition is less common given the thin walled nature of the LA. Although correlation between LA dimension and LA volume indexed for body surface area (LAVI) is significant (r=0.69, p<0.001), LAVI is increased in nearly 60% of patients with normal LA dimension.5 For patients in sinus rhythm, LA volumes can be measured throughout the cardiac cycle, and systolic and diastolic volumes can be subtracted for calculation of LA emptying volume.6
Figure 2a. LA volume calculated using the method of discs (Simpson’s rule) in the apical 4-chamber view. The calculation is performed using automated software.

Figure 2b. LA volume calculated using the method of discs (Simpson’s rule) in the apical 2-chamber view. The biplane measurement is calculated using the diameters from both views to calculate the volume of each disc and then summing the volumes together.
In the setting of AF, increased LA size represents both cause and consequence. In longitudinal studies, increased LA dimension is an important predictor of risk for the development for AF.7,8 Subsequently, both right atrial (RA) and LA size increase once AF occurs.9 The increase in biatrial size is progressive and is directly related to AF duration.10 Conversely, both RA and LA size decline within hours following cardioversion and maintenance of sinus rhythm.1 The decline continues to progress for up to 8 months (if sinus rhythm is maintained).12 Patients who convert spontaneously enjoy a faster rate of reduction in LA dimension compared to those who require either electrical or chemical cardioversion.13
Studies investigating the relation between LA size and the ability to maintain long term restoration of sinus rhythm following cardioversion have produced discrepant results. Several studies have reported reduced rates of maintenance of sinus rhythm in patients with LA anteroposterior dimension >45 mm.14-16 Other observers have reported no relation between any echocardiographic descriptor of LA size17-19 or any cutoff point predictive of long term success post cardioversion.20 Studies representing both sides of this issue have often been limited by small sample size, heterogeneous populations and short term follow-up.In the largest (411 patients) and most recent study to date, patients maintaining sinus rhythm for at least 6 months had significantly smaller LA volumes (31.4 ml/m2) than those who did not maintain sinus rhythm (39.7 ml/m2).21Although the RA has not been studied as extensively, changes in RA size and function pre and post cardioversion appear to parallel those observed in the LA.9,11,12
Although 2D guided M-mode measurement of LA dimension has provided important clinical and prognostic information, the correlation between calculated LA volume and LA dimension is relatively poor,22 and LA volume has been shown to be superior to the older measurement.23,24 LAVI has emerged as a powerful predictor of outcome in a wide variety of settings including heart failure,25,26 myocardial infarction,27 and ischemic stroke.28 In a large (n=1655) prospective series, LAVI emerged as a highly significant predictor of the development new AF.29 In patients with lone AF, increased LAVI predicts a higher frequency of adverse cardiac events.30
Functional Measures of LA Function Pre and Post Cardioversion
Interrogation of diastolic flow through the mitral valve using spectral Doppler provides a powerful measure of LA passive and mechanical function. Following cardioversion from AF, the presence of a p wave on the surface electrocardiogram demonstrates the return of atrial electrical activity. Return of atrial mechanical function, however, as demonstrated by the transmitral (and transtricuspid) time velocity integral (VTI) produced by atrial contraction (A wave) is often delayed.31 The rate of return of atrial mechanical function is dependent on both the duration of AF prior to cardioversion32,33 and the mode of cardioversion.34 Biochemical function, as demonstrated by the progressive return of plasma atrial naturetic peptide, reappears coincident with A wave return.35 Although initial A wavevelocities post cardioversion are not predictive of long term success,31-36 lack of A wave progression, and peak transmittal A wave velocity at 24 hours in patients who maintain sinus rhythm are higher compared to those return to AF post cardioversion.37
Atrial ejection force describes the force generated by the contracting atrium in terms of classical mechanics; force=mass x acceleration.38 The mass of blood ejected by the LA is calculated as the product of blood volume ejected during the acceleration phase x blood density (ρ).The blood volume ejected during the acceleration phase is calculated as ½ the time velocity integral of the A wave x the mitral valve annular diameter, and acceleration is calculated as the 1st derivative of the change in A wave velocity, dA/dt, again during the acceleration phase.Combining the two variables cancels out the time factor and simplifies to:Atrial ejection force= 0.5 (mitral valve area) (peak A wave velocity )2
In a fashion analogous to peak A wave velocity, recovery and magnitude of atrial ejection force is a predictor of long term maintenance of normal sinus rhythm.38
For patients in AF, LA appendage (LAA) flow measured by transesophageaal echocardiography (TEE) guided pulse Doppler interrogation at the mouth of the LAA is a powerful predictor of both thromboembolic risk and rhythm outcome. The pattern produced by the LAA flow in AF differs distinctly from that seen in sinus rhythm; the characteristic 4 phase pattern of appendage filling and contraction (Figure 3a)39 is replaced by an irregular chaotic series of waves of varying velocity (Figure 3b). As LAA function deteriorates, the morphology of the flow velocity becomes less distinct and peak velocity declines markedly (Figure 3c). Decreased mean LAA flow velocity (<40 cm/sec) is strongly correlated with a high frequency of spontaneous echo contrast,40 increased incidence of LAA thrombus41-43 and subsequent clinical thromboembolism.44 Reduced LAA flow velocity (<20 cm/sec) is also a significant negative predictor of maintenance of sinus rhythm following cardioversion.45-47 TTE has also been reported to be a useful modality for evaluation of LAA appendage size and function.48 However, the utility of TTE for identification of AF patients who can be safely cardioverted without prolonged anticoagulation is unknown.
Figure 3a. The pulse spectral Doppler appearance of LA appendage (LAA) flow during sinus rhythm (Reprinted with permission from Silverman DI and Manning WJ, The Complete Guide to Echocardiography. Jones & Bartlett Learning 2001; Sudbury MA)
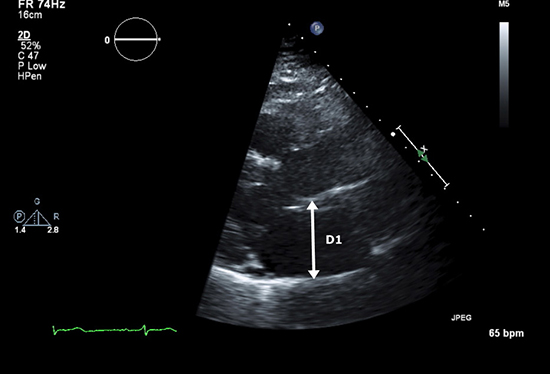
Figure 3b. LAA flow during atrial fibrillation. Flow velocities in this example are normal (>40 cm/sec).
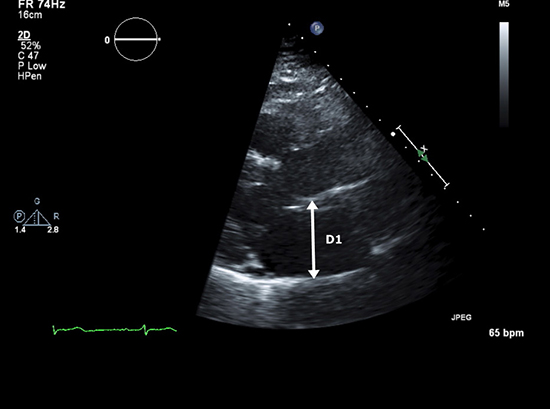
Figure 3c. LAA flow velocities are marked reduced in this example.

TEE Guided Cardioversion of AF and Its Role in Catheter Ablation
Since the first report of the use of TEE for identification of LAA thrombi in patients with AF, TEE guided cardioversion has endured as a therapeutic strategy for converting patients with AF (and atrial flutter) to sinus rhythm without the use of prolonged pre-cardioversion anticoagulation. Compared to the gold standard of open surgical visualization, the sensitivity of TEE for detection of LA thrombi is 100%, and the specificity is 99%.49-53 To date, four prospective trials have documented an equivalent incidence of clinical thromboembolism following a negative TEE for thrombus, compared with the traditional approach of 4 weeks of therapeutic warfarin anticoagulation (International Normalized Ratio 2-3) (Table 1).54-57 In addition, TEE guided cardioversion is associated with a reduced incidence of bleeding,55 is cost effective,58 and may be associated with an interval dependent improvement in the frequency of long term suppression of AF post cardioversion.59 The efficacy of the technique depends crucially upon the use of anticoagulation (INR 2-3) in the peri-cardioversion and post-cardioversion period.Data demonstrate more impaired LAA ejection velocity post electrical, chemical and even spontaneous cardioversion. The majority of clinical thromboembolic events following a TEE negative for thrombus have occurred either in the setting of subtherapeutic anticoagulation or in the absence of anticoagulation altogether. Anectodal reports have also demonstrated apparent dissociation of function between the body of the LA (in sinus rhythm) and the LAA (in mechanical AF).60Administration of echo contrast has been reported to improve accuracy for LAA thrombus detection (Figures 4a and 4b).61
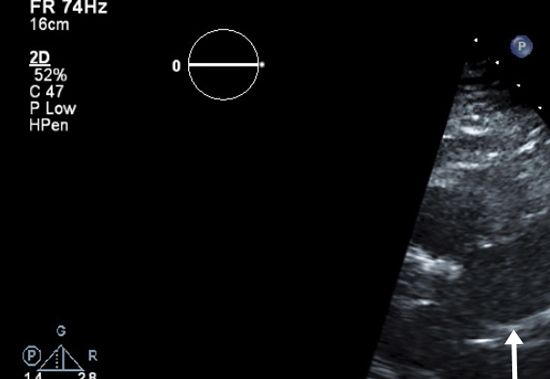
Figure 4a. Transesophageal echocardiography (TEE), midesophageal view in a patient reveals an indistinct haziness (arrow) in the body of the LAA.
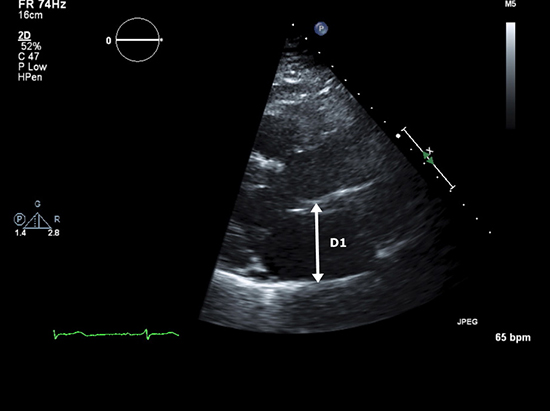
Figure 4b. Injection of 2 cc of echo contrast (?Definity) solution completely opacifies the LAA , providing convincing evidence that there is no thrombus.The patient underwent successful conversion to sinus rhythm a few moments later without complication.

Table 1. Studies Evaluating Association of Diabetes with Atrial Fibrillation
| Study
|
(%) (n) of Patients Enrolled |
(%)(n) of Patients w/ A thrombi |
% (n) of Embolic Events Post cardioversion |
| Manning(54) |
223 |
15(34) |
0(0) |
| Stoddard(56) |
206 |
18(37) |
0(0) |
| Seidl(57) |
719* |
7.7(55) |
0.8(6) |
| Klein(55) |
619* |
76(14) |
0.8(5) |
Although prospective data validating TEE for exclusion of LAA thrombi prior to catheter ablation are somewhat limited,62 the technique has gained wide acceptance for that purpose.63,64 Whether TEE is required for exclusion of thrombi in lower risk patients remains controversial,65 as several observers have reported an incidence of LAA thrombi of <1.5% in patients with a CHADS2 score ≤1,66,67while Others have reported a small but persistent incidence of thrombi even in the presence of therapeutic anticoagulation.68 TEE is also commonly employed in combination with alternate imaging modalities for identification of pulmonary vein anatomy and location, and for determination of pulmonary vein stenosis post procedure.69 3D TEE provides an important tool for catheter placement during transeptal puncture, especially in the presence of structural abnormalities not readily detected by conventional radiographic imaging techniques70,71
Measures of LA Function Derived from Tissue Doppler Imaging and Speckle Tracking
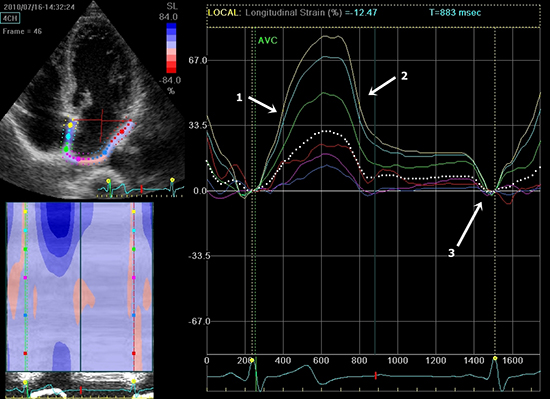
The application of techniques for measurement of atrial strain provides a novel technique for assessment of the relation between LA function and AF in a variety of settings. Strain describes the rate of myocardial deformation as the ratio of the difference in shortening of a particular segment to its initial length; L-L0/L0 where L0 =initial length and L=shortened length (Figures 5a). Systolic strain is thus by convention a negative value, as is its 1st derivative with respect to time, strain rate. Peak systolic strain can be calculated for any desired length and at any location along the blood tissue interface. While measurement of atrial strain and strain rate are still in their earliest phases, several intriguing findings have already been reported. Compared to LAA flow velocities, reduced atrial myocardial velocity, strain and strain rate are superior predictors of persistence of sinus rhythm after cardioversion.46,72 Increased LA strain is also predictive of long term success post catheter ablation of AF 73-75 and long term reduction in atrial volume post procedure.76 Post cardioversion, atrial strain rate increases for up to 30 days and is correlated with increasing A wave velocity ( ).
Figure 5. Atrial strain mapped using speckle tracking.
Echocardiographic Predictors of Thromboembolism in AF
While the average annual stroke risk for unanticoagulated patients in AF approximates 5%,78 individual risk varies greatly. In addition to well described clinical factors,79 a number of echocardiographic variables have endured as consistent predictors of increased risk for thromboembolism. Reduced left ventricular ejection fraction (LVEF) (<35%) is considered such a powerful factor that its presence is an indication for anticoagulation regardless of other factors.80 Mitral regurgitation appears to be protective 81( TEE parameters of increased clinical thromboembolic risk 42,74 and mortality51 include spontaneous echo contrast, decreased LAA fibrillatory wave velocity and LA thrombus (Figures 6), and complex aortic plaque.
Figure 6. TEE midesophageal view demonstrates LAA thrombus (arrow).
Although no single echocardiographic variable discriminates between the presence and absence of LAA thrombus, increased LA volume index, especially in combination with reduced LVEF is associated with increased frequency of LAA thrombus formation at every level of CHADS2 score.42 Conversely, in low risk patients (CHADS2 score ≤1) a normal LVEF and normal LAVIare associated with the near absence of LAA thrombus.42 We have observed similar results in a series of patients with AF and CHADS2 score ≤1, in which LAVI is significantly increased compared to age and sex matched controls (unpublished data). Atrial strain is reduced in patients with AF and previous stroke compared to stroke free controls82 and decreased LA strain is associated with increased stroke risk as determined by CHADS2 scores.83
In summary echocardiography in all its manifestations plays an irreplaceable role in the management and prognosis of patients with AF. As it has in the past, we expect future advances in echocardiography will continue to strengthen this enduring partnership between imaging and arrhythmia.


